Generate Gene Venn Diagram Representations with OmicsBox
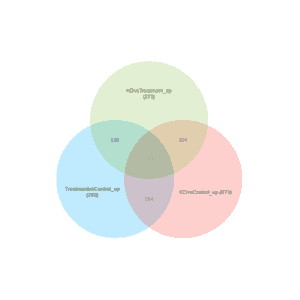
What is a Gene Venn Diagram? A Gene Venn Diagram is a graphical representation in the form of overlapping circles widely used to represent relationships among different genes (IDs). High-throughput sequencing technologies generate large amounts of data sets coming from multiomics studies. At the transcriptomic level, differential expression analysis appears to be a highly important field of study in bioinformatics