Quality Control, Assembly, Quantification and Differential Expression
The OmicsBox Transcriptomics module allows you to process RNA-seq data from raw reads down to their functional analysis in a flexible and intuitive way.
Quality Control
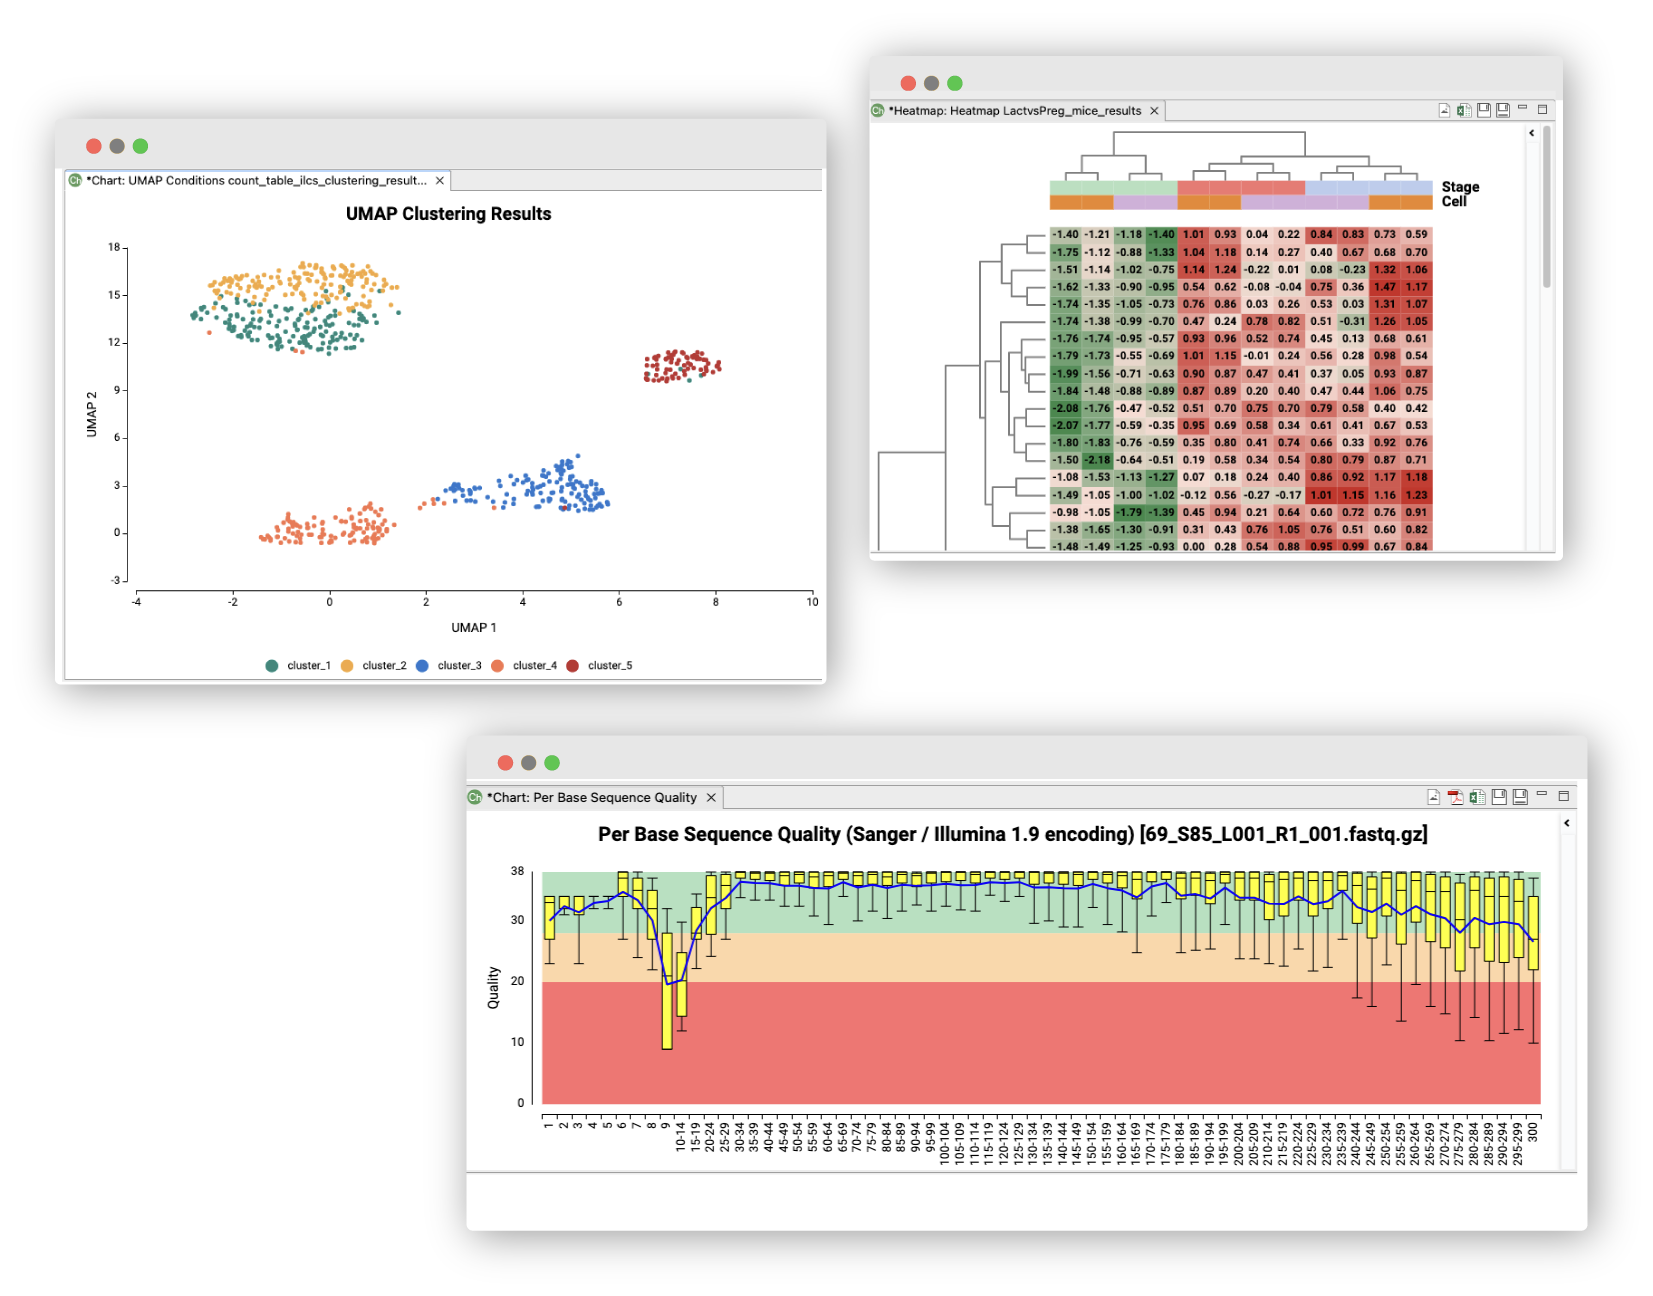
Use FastQC and Trimmomatic to perform the quality control of your samples, to filter reads and to remove low quality bases.
De-Novo Assembly
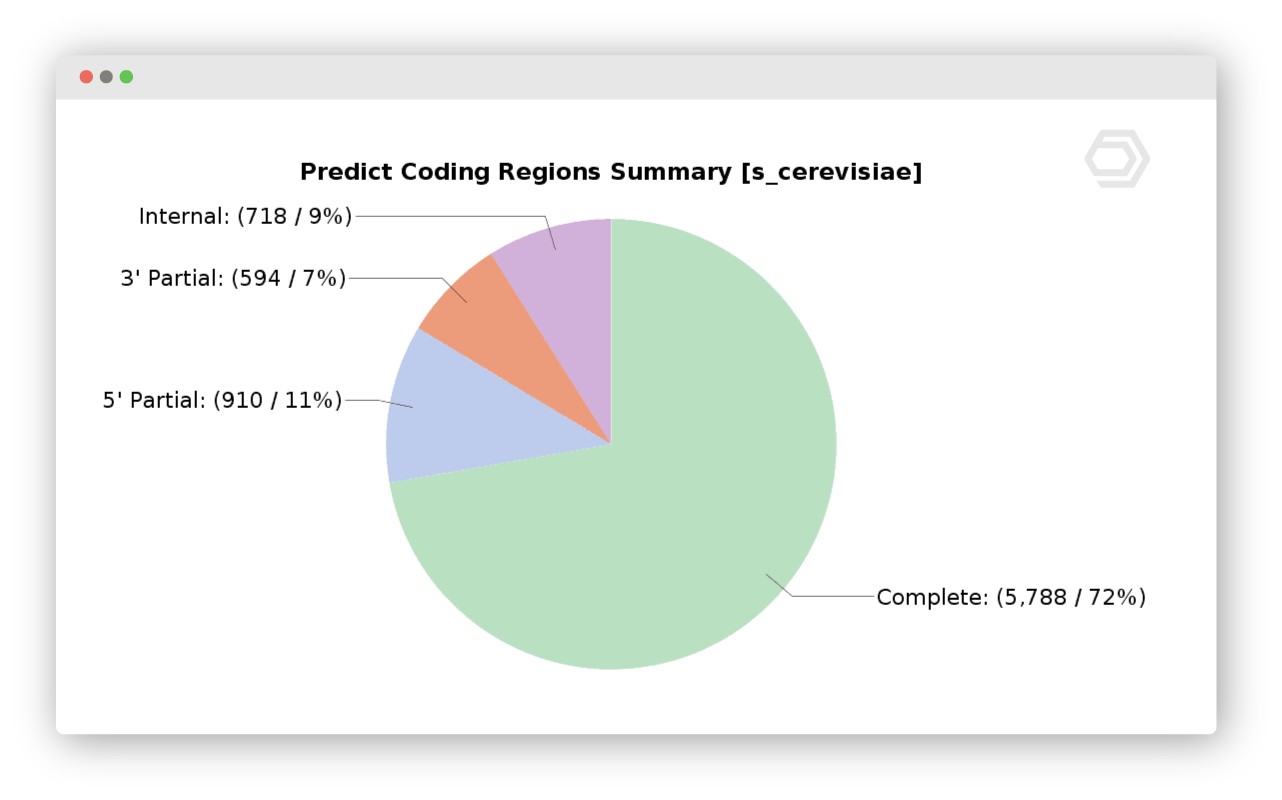
Assemble short reads with Trinity to obtain a de-novo transcriptome without a reference genome. Assess the completeness of the transcriptome with BUSCO and cluster similar sequences with CD-HIT. Moreover, you are able to predict coding regions with TransDecoder or assess the coding potential of each sequence with CPAT.
RNA-Seq Alignment
Align RNA-seq data to your reference genome making use of STAR (Spliced Transcripts Alignment to a Reference) or BWA (Burrows-Wheeler Aligner) regardless of your hardware. In addition, BAM-QC provides several useful modules to evaluate RNA-seq alignment files.
Quantify Expression
Quantify expression at gene or transcript level through HTSeq or RSEM and with or without a reference genome.
Differential Expression Analysis
Detect differentially expressed genes between experimental conditions or over time with well-known and versatile statistical packages like NOISeq, edgeR or maSigPro. Rich visualizations help to interpret results.
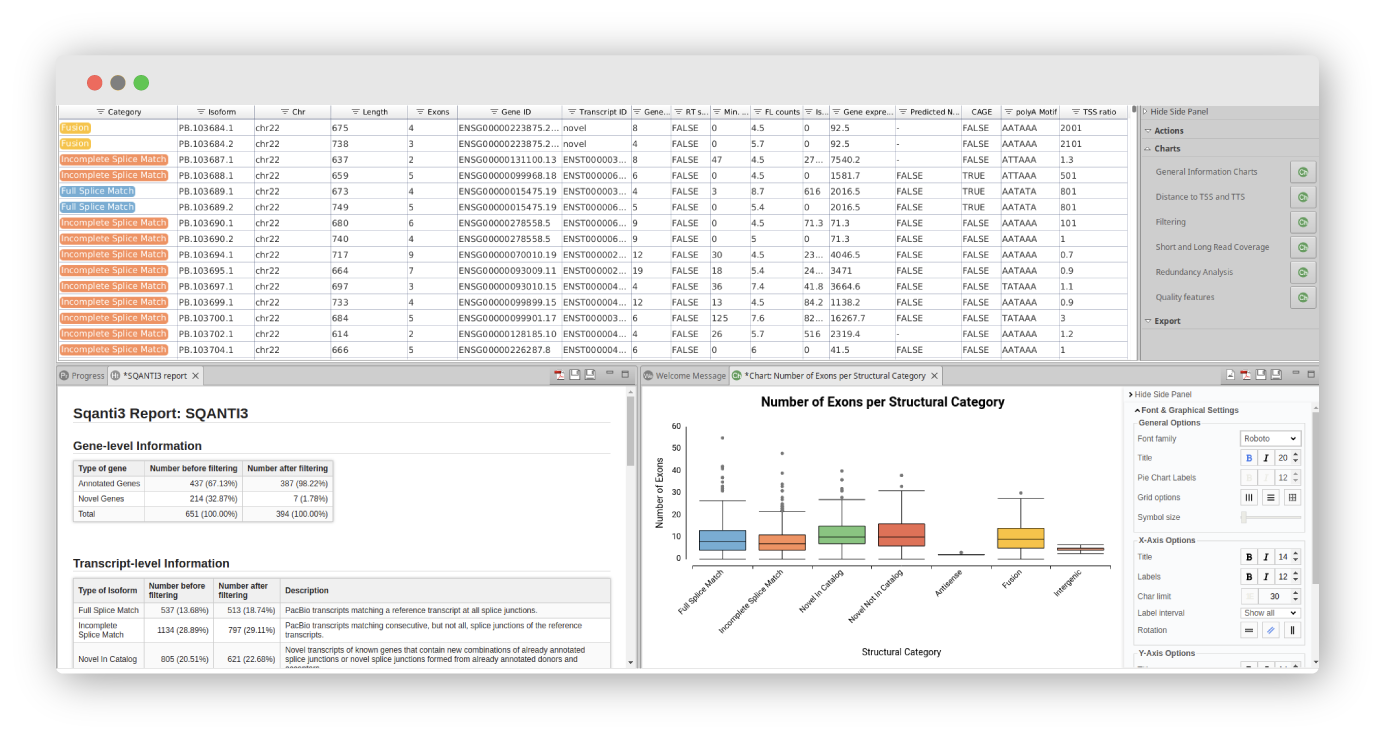
Long-Read Analysis
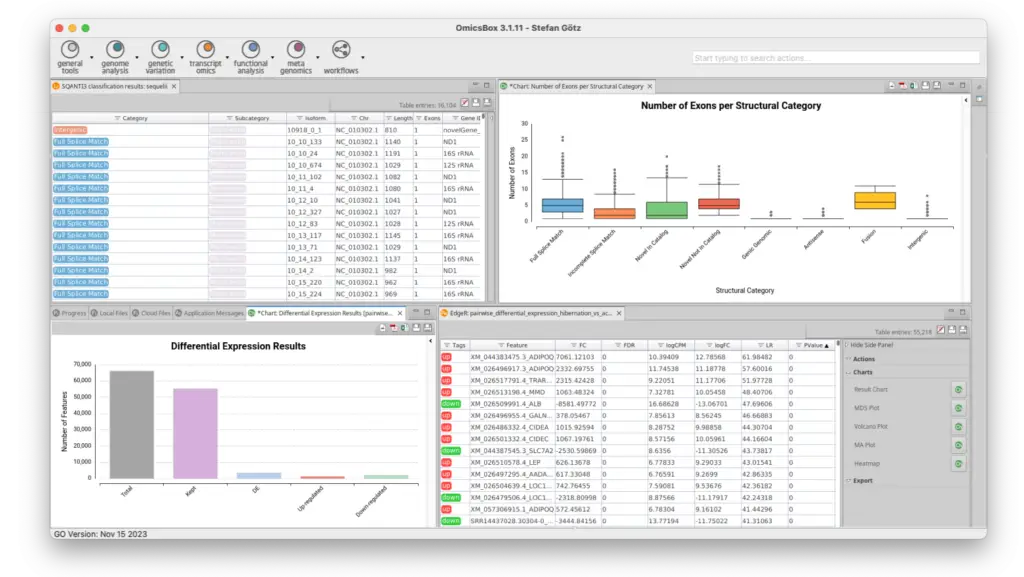
Use LongQC to assess the quality of long-read datasets without a reference genome. Identify long-read-sequenced transcripts with IsoSeq3, FLAIR, or IsoQuant and then perform a long-read transcriptome analysis and characterization using SQANTI3. With this implementation, you will obtain a curated transcriptome including a detailed analysis report.
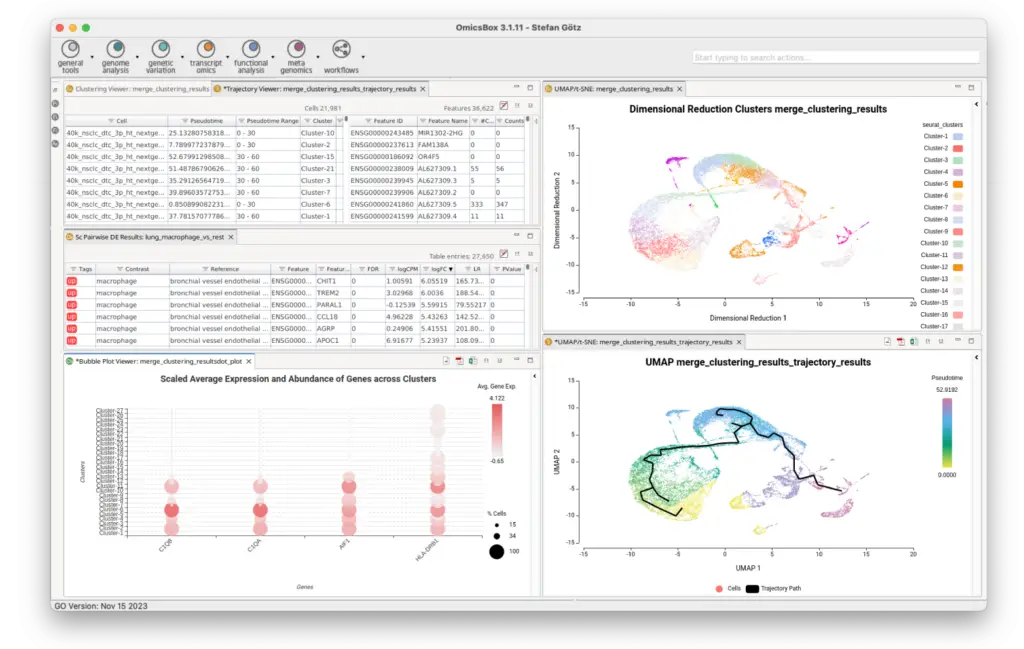
Single-Cell RNA-Seq
Obtain scRNA-Seq counts seamlessly with STARsolo for different library-prep technologies. Perform Single-Cell RNA-Seq clustering with Seurat to identify groups of cells and examine marker genes’ expression. Gain insight into cell transitions with Monocle3 and visualize cell lineage trajectories in pseudo-time.
Enrichment Analysis
By combining differential expression results with functional annotations, enrichment analysis allows to identify over- and underrepresented biological functions.
Transcript-level expression quantification with RSEM
Pairwise differential expression analysis with edgeR
Pairwise differential expression analysis without replicates with NOISeq
Time course expression analysis with maSigPro
Long-read transcript identification with IsoSeq3
Curation of Long-Read Transcriptomes with SQANTI3 v.5
Single-Cell RNA-Seq Quantification Feature with StarSolo
Single-cell RNA-Seq clustering with Seurat v.5
Single-cell RNA-Seq trajectory inference with Monocle3
Single-cell RNA-Seq differential expression analysis with EdgeR v.4
Visualizations: Gene Trends and Expression UMAP
Cell Type Identification with SingleR
Autocorrelation Analysis via Monocle3
Isoform Definition and Quantification with IsoQuant
Reference-Free Long-Read Transcriptome with isON pipeline
FLAIR v.2 including Quantification
Batch Renaming of Feature IDs for Count Tables and Differential Expression Results
Renaming and Deleting of Samples for Count Tables
Improved UMAP Performance for Large Datasets
Combine Transcriptomes with TAMA Merge
Redesigned PacBio IsoSeq Pipeline
Experimental Design Export Option for Differential Expression Results
Dive in: Transcriptomics Module Highlights
Single Cell
Unlock the power of advanced Single-Cell insights with OmicsBox.
With our user-friendly platform, Single Cell RNA-Seq analysis becomes accessible to every scientist, with a focus on dynamic data exploration and interactive visualizations.
Different statistical charts provide additional information about the assembly and quantification processes as well as a quality assessment of the results.
Rich Visualizations
Interactive heatmaps help to intuitively check the differences and similarities between the expression values of the different genes and samples.
Spreadsheet Alike
Sort and filter the differential expression results and adjust the statistical criteria to review significant genes and combine them with functional information to gain biological insights.
Detailed Information
Different reports, charts, and tables allow to obtain an in-depth understanding of what is happening with your data.
Get Started with OmicsBox
Get familiar with all new Modules and Features with a Free Trial or a Custom Demo. OmicsBox works out of the box on any standard PC or laptop with Windows, Linux and Mac.
Generate your own reference transcriptome by de novo assembling RNA-seq reads. Assess the completeness of the assembly, cluster similar sequences to reduce redundancy. Finally, predict coding regions and find homologous sequences to characterize transcript sequences.
Gene-level Analysis
When reference is available, perform a gene-level analysis by aligning RNA-Seq reads against the reference genome. Then estimate the expression value of each gene and perform differential expression analysis.
Transcript-level Analysis
Estimate expression at the transcript-level by mapping reads to the transcriptome (such as a de novo assembled transcriptome), and perform differential expression analysis to identify significant transcripts.