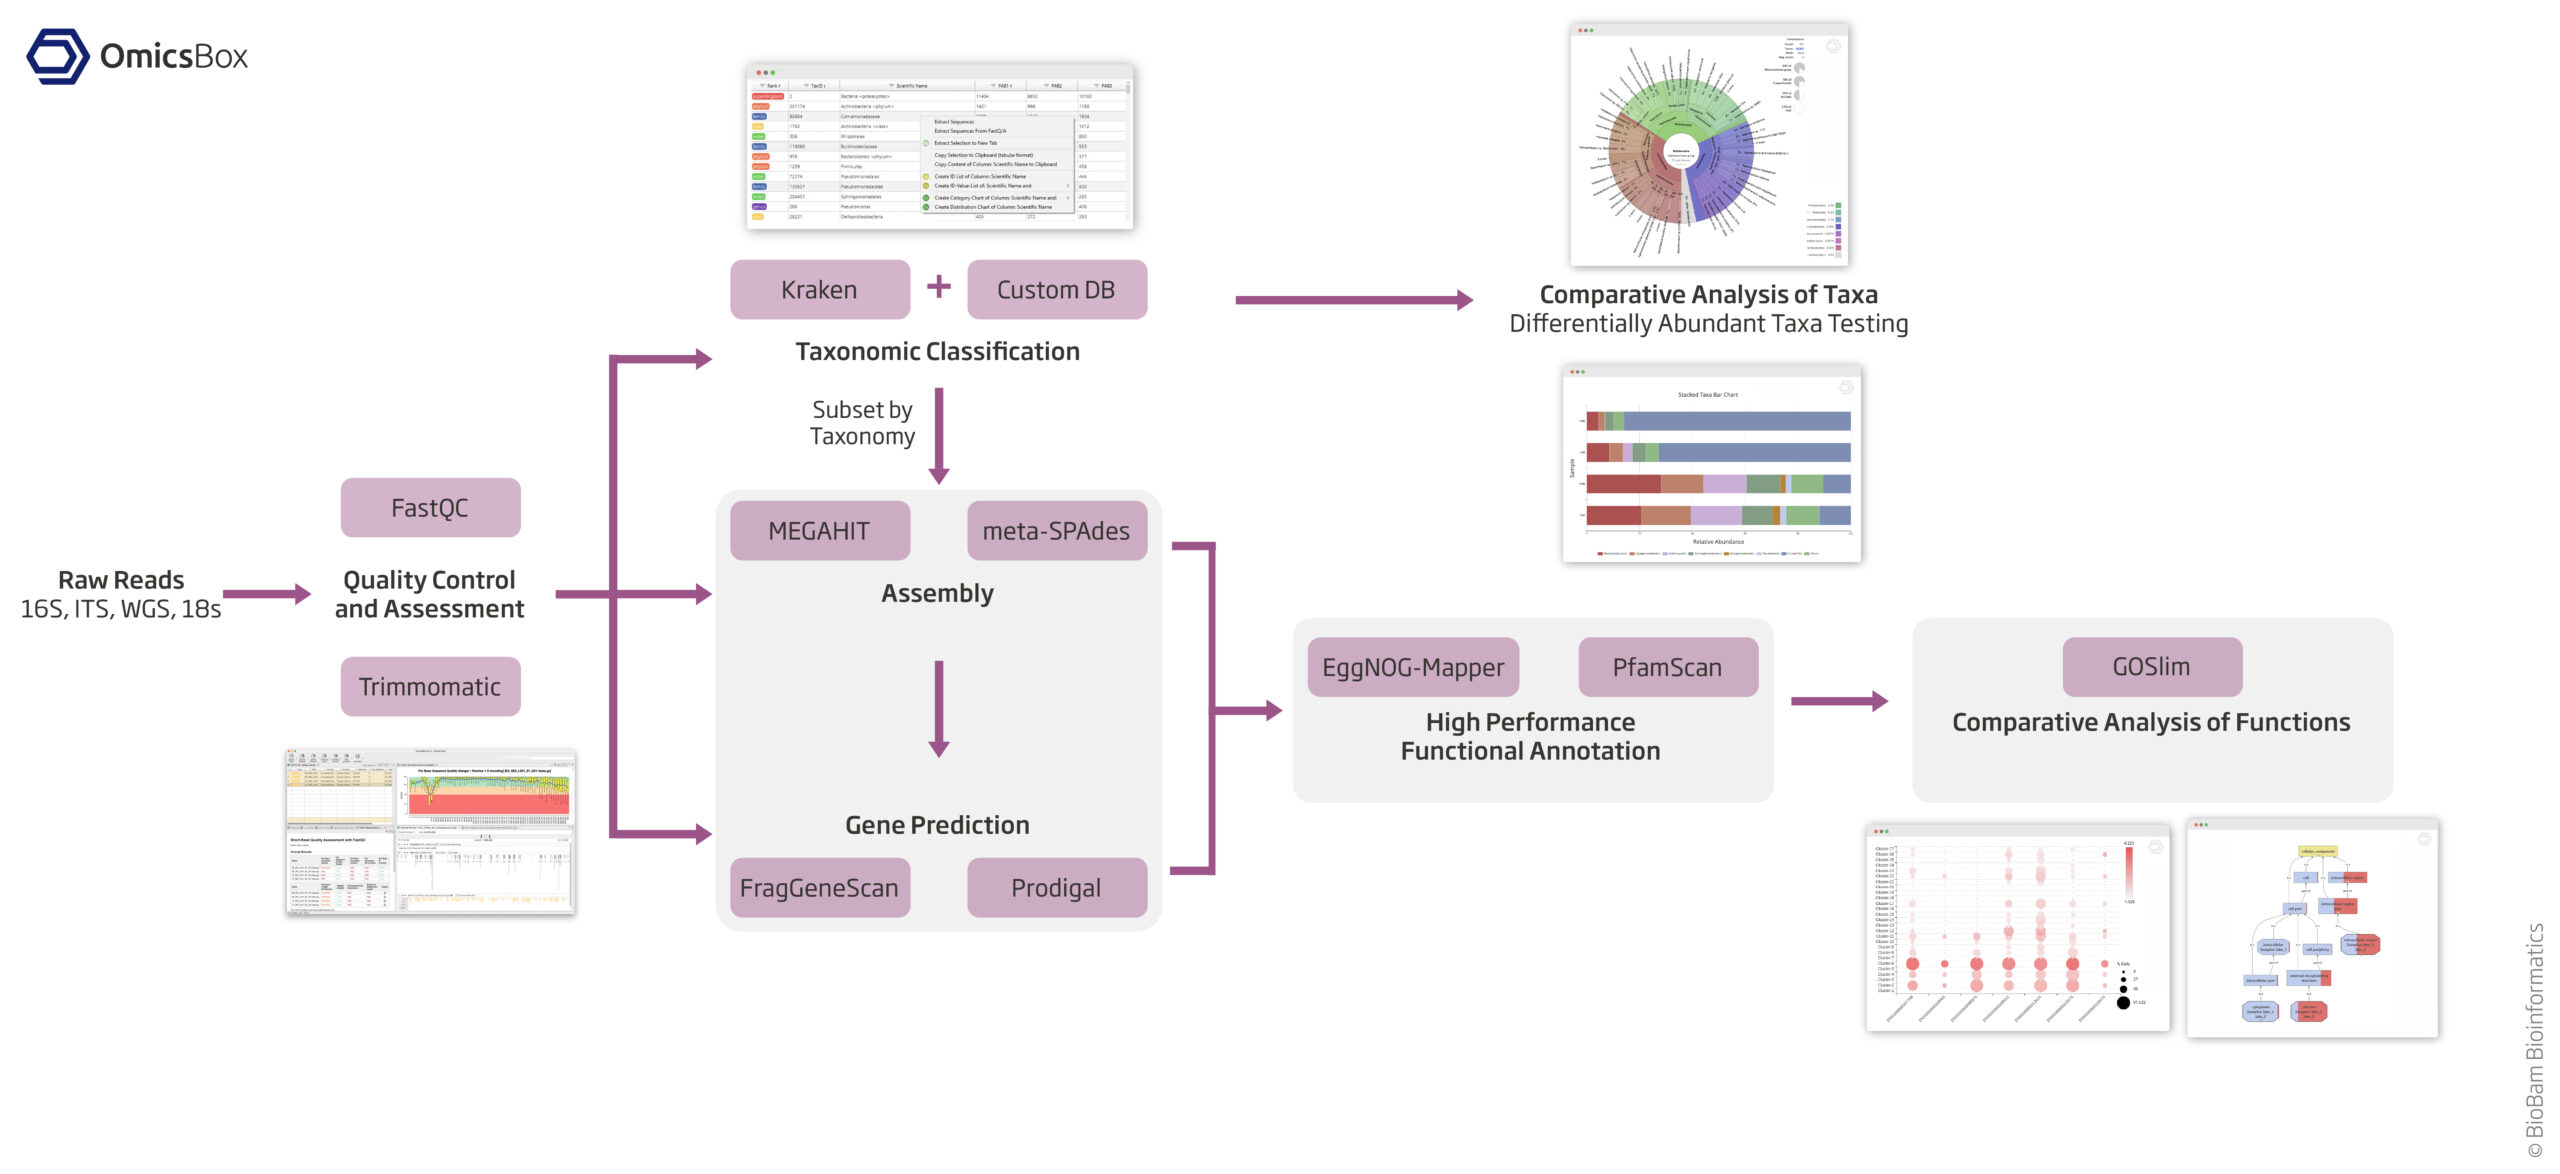
Taxonomic and Functional Classification, MetaAssembly and GenePredictions,
Comparative Analysis
Quality Control And Assessment
Use FastQC and Trimmomatic to perform the quality control of your samples, to filter reads and to remove low quality bases.
Taxonomic Classification
Identify Bacteria, Archaea, Fungi, Protozoa, and Virus down to strain level with Kraken 2. Gain insights from rich visualizations and test for the differential abundance of taxa.
Metagenomic Assembly
Choose between MetaSPAdes and MEGAHIT to assemble large datasets easy and fast in the cloud.
Gene Prediction
Use FragGeneScan for plain reads and Prodigal for assembled data to identify and extract possible genes and proteins.
Functional Analysis
Obtain high-throughput functional annotations with EggNOG-Mapper and PfamScan. Results can be compared visually and differential abundance testing of functions is also available.
All computational-intensive tasks are taken care of in the BioBam Bioinformatics Cloud.
An ordinary computer or laptop is sufficient to perform all tasks described on this page.
Contaminant removal with Bowtie2 against existing or user-provided target genomes.
New Taxonomic Classifications via Silva, Greengene and GTDB.
Taxonomic classification with Kraken 2
The database contains WGS RefSeq genomes of Archaea, Bacteria, Protozoa, Fungi, Virus and some possible host organisms:
Homo sapiens, Mus musculus, Rattus norvegicus, Bos taurus, Sus scrofa, Drosophila melanogaster, Arabidopsis thaliana
New Kraken Databases: UNITE Fungi and MiDAS 5.
Appropriate for 16S/ITS amplicon and WGS read data.
The main result table shows all identified OTUs for each provided sample.
A PDF report shows the overall input and carried-out analysis information.
Stacked bar chart to compare samples at specific taxonomic levels.
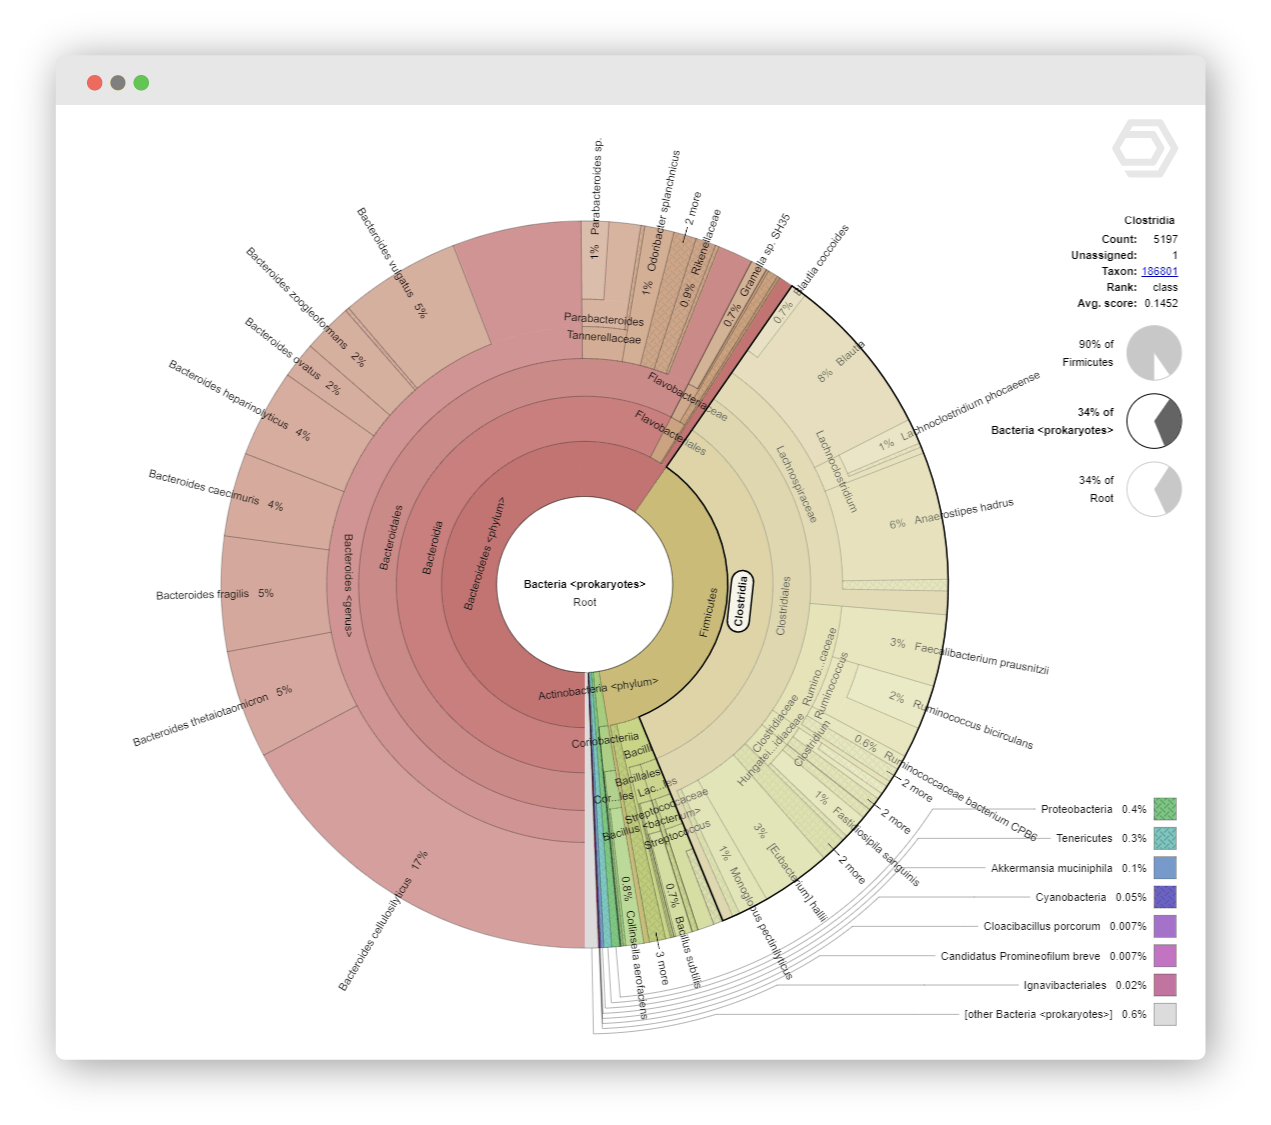
Radial cladogram in the form of a Krona chart to study OTU abundances in each sample.
Rarefaction curves to assess the sequencing depth at different taxonomic levels.
Chao1 species richness curve to evaluate the species diversity (different levels possible + sample selection).
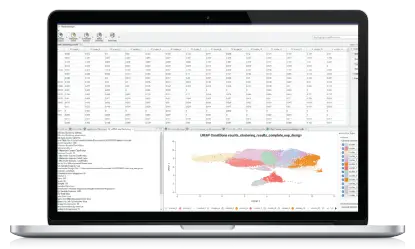
Principal Coordinates Analysis plot to see how samples and groups separate and to identify outliers.
OTU Differential Abundance Testing identifies over and underrepresented OTUs between samples and conditions with the help of edgeR.
Metagenomic assembly with meta-SPAdes and MEGAHIT.
Metagenomic gene prediction with FragGeneScan and Prodigal.
Metagenomic functional analysis with eggNOG-Mapper and PfamScan.
Metagenomic GO-Slim.
Comparative analysis of functions with bar charts and GO graphs.
Differential abundance testing of functions.
Pfam Domains and Families
KEGG Maps and EggNOG COGs
rRNA removal with SortMeRNA to prepare metatranscriptomic NGS-data for analysis.
PCoA Configuration Options.
The Metagenomics Module of OmicsBox allows to combine and integrate all necessary steps for a complete microbiome data analysis in a flexible and intuitive way. Create custom pipelines for individual analysis strategies.
Taxonomic Classification
Sort and filter the taxonomic classification results, and extract all reads that belong to selected taxonomic units. Refine your reports with customized distribution charts in various styles.
Rich Visualizations
Colorful and interactive charts help you to intuitively explore your data. Explore all samples with their relative species abundances and confidence scores within the complex hierarchies of metagenomic classifications.
Dive in Metagenomics: Our Module Highlights
Microbiome Case Study for Targeted Sequencing and WGS Metagenomics
Take a look at this overview of metagenomic analysis options using OmicsBox.
The session covers quality control and assessment, taxonomic classification with Kraken2, and result interpretation. Also explores differential abundance analysis, illustrating how variations in microbial populations can be compared between samples.
Interactive bar charts help understanding inter-sample relations at for example the genus or species level. It shows you a quick overview of taxonomic abundance compositions between different samples.
Differential Abundance Testing of Taxa
Use edgeR to test OTUs at different levels in different groups against each other to determine differential abundance. In addition to the plain results, a PDF report and a heatmap and other visualizations help to interpret your findings.
Differential Abundance Testing of Functions
Test for the differential abundance of annotated functions between samples and create visualizations such as this bubble chart.
Have a look at the poster we presented in Rotterdam at the Microbiome & Probiotics R&D & Business Collaboration Forum.
Get Started with OmicsBox
Get familiar with all new Modules and Features with a Free Trial or a Custom Demo. OmicsBox works out of the box on any standard PC or laptop with Windows, Linux and Mac.
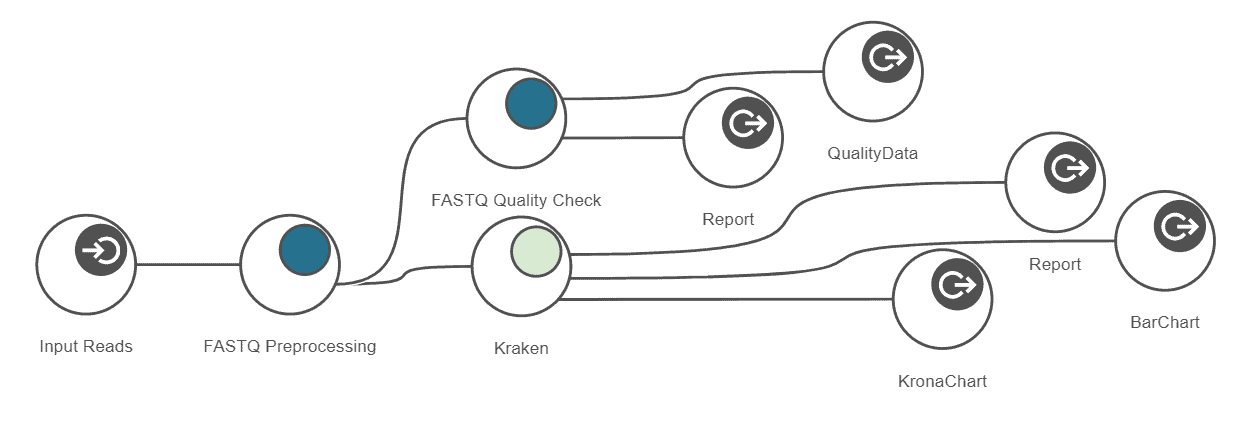
This example workflow shows a basic taxonomic classification of metagenomics data with OmicsBox. The reads are preprocessed (Trimmomatic) and a report is generated (FastQC). Kraken is used to identify and count all different operational taxonomic units (OTUs) for further interpretation. The spreadsheet-like result can be filtered and organized. The PDF report gives a clean overview of most abundant OTUs at different levels for each sample. Results also include intra- and inter-sample comparison charts. The whole workflow can be started within a few clicks and computationally intensive parts run transparently on the cloud.
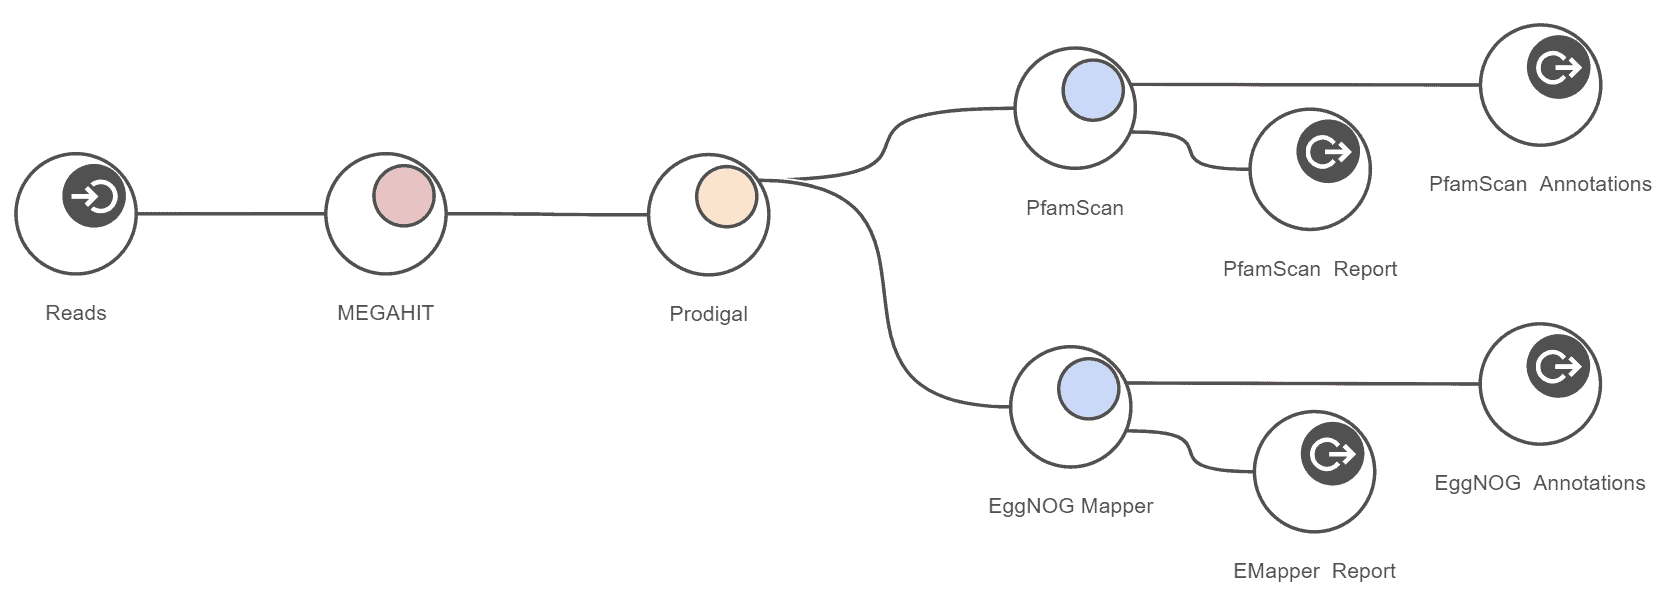
Functional Characterization
Functional characterization of metagenomics data is a complex task. The OmicsBox Metagenomics module allows you to design streamlined workflows to easily combine the typically resource-demanding assembly step with gene predictions, as well as high-throughput functional annotation for large metagenomics data-sets. This example workflow shows the combination of MEGAHIT with Prodigal. Fast and comprehensive functional annotation is achieved with the integration of EggNOG-Mapper and PfamScan. Results are presented in form of spreadsheets and can be filtered and visualized with hierachical bar- and graph charts.