In this use case we will use the metagenomics tools included in OmicsBox to analyze the microbial communities of two different soda lakes from Brazil. The original study was carried out by Ana P. D. Andreote, et al., 2018 (doi: 10.3389/fmicb.2018.00244).
Introduction
Soda lakes are special ecosystems found across Africa, Europe, Asia, etc. These lakes show high levels of sodium carbonate and an elevated salinity and pH. Given their special nature, it is interesting to examine their taxonomic composition and their functional patterns.
Salina Preta and Salina Verde (Mato Grosso do Sul, Brazil) are two soda lakes which mainly differ by permanent cyanobacterial blooms in Verde, while Preta shows no record of cyanobacterial blooms. Therefore, it can be expected that highly different microbial communities and functional compositions are present between lakes.
The objectives of the study are:
- To describe the bacterial diversity between Salina Preta and Salina Verde, and to identify the microorganisms responsible for blooms in Salina Verde.
- To identify the functional genetic potential of these microbial communities.
1. Data description (MG-RAST)
The Data was downloaded from the MG-RAST server (mgp10309). 12 single-end metagenomic samples were considered for the analysis: three replicates for each lake, taken at two different times, morning and afternoon. Samples were collected at two different depths: 0.25 m in Salina Verde, and 0.35 m in Salina Preta.
| Lake | Time of Sampling | Replicates | Sample Names |
| Preta | Morning (10 AM) | 3 | PMB1, PMB2, PMB3 |
| Preta | Afternoon (3 PM) | 3 | PAB1, PAB2, PAB3 |
| Verde | Morning (10 AM) | 3 | VMB1, VMB2, VMB3 |
| Verde | Afternoon (3 PM) | 3 | VAB1, VAB2, VAB3 |
2. FastQC and Preprocessing
Firstly, we performed a quality assessment of the metagenomic libraries with OmicsBox (General Tools > FASTQ Quality Check). All datasets seemed to have an adequate quality, but a small percentage of the sequences still contained Nextera adapters.
Thus, we performed a preprocessing step on the samples (General Tools > FASTQ Preprocessing). We removed the Nextera transposase adapters and applied a quality filter and a length filter to retain only sequences longer than 80 nucleotides, with a Phred quality score higher than 30.
3. Taxonomic Classification
To study the taxonomic community compositions of both lakes, we used the taxonomic classification functionality in OmicsBox (Metagenomics > Taxonomic Classification), based on the Kraken, with the preprocessed reads as input.
To explore the classification results, we obtained various charts and plots.
First of all, we generated a Principal Coordinate Analysis (PCoA) with Bray-Curtis distances, which suggests that big differences exist between the taxonomic compositions of Salina Verde and Salina Preta, as the first coordinate discriminates them perfectly. The X-Axis label informs us that this separation explains about 80% of the variance in the whole dataset.
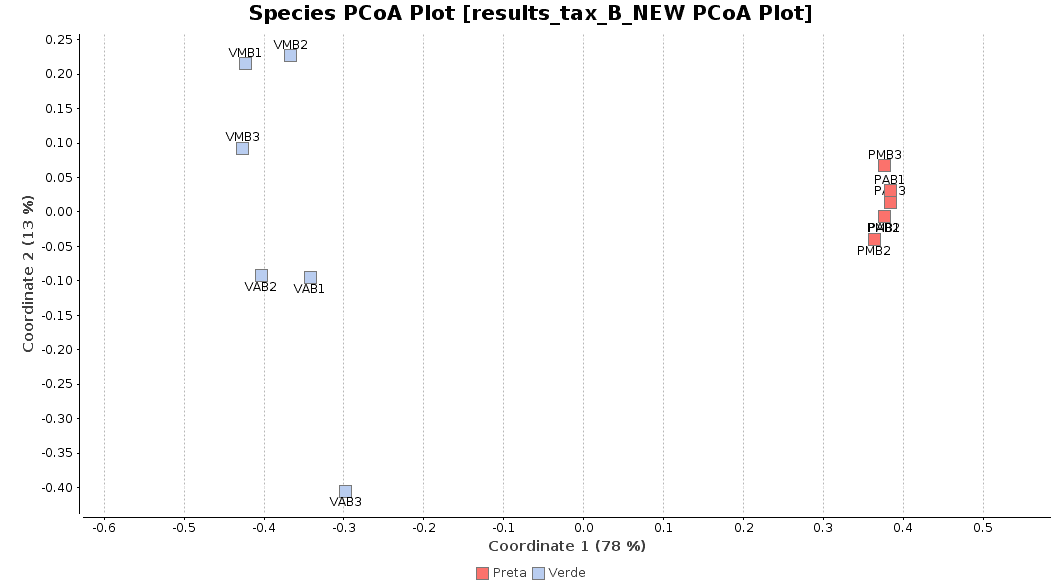
Figure 1. Principal Coordinate Analysis.
A Phylum composition bar chart suggested what we have said above: there are big differences between lakes, but no clear differences between sampling times (morning and afternoon) were observed.
The dominant phylum in Salina Verde was Cyanobacteria (80% of the classified sequences), followed by Proteobacteria (15%) and Actinobacteria (1%). The rest of the classified sequences was divided into Bacteroidetes, Firmicutes and others, with very low proportions (<1%).
In Salina Preta, the main phyla were Proteobacteria (75%), Actinobacteria (10%) and Bacteroidetes (3%). The Cyanobacteria proportion in this lake was very low compared to the proportion found in Salina Verde (1% and 80%, respectively).
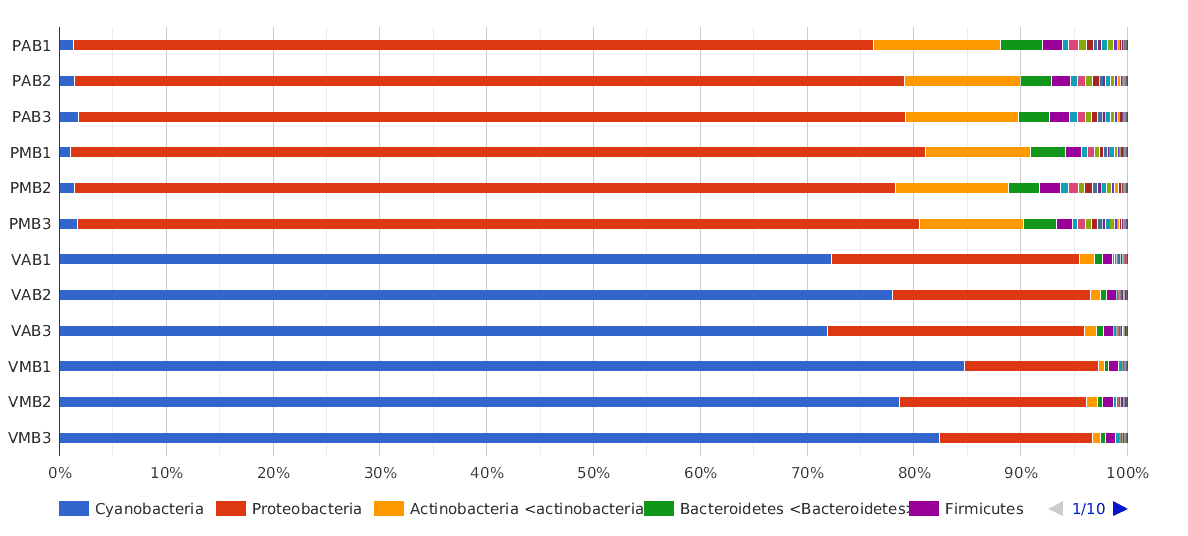
Figure 2. Taxonomic Classification bar chart by Phylum.
With regard to the biodiversity in this dataset, two graphs were observed: an accumulation curve and a rarefaction chart, both at species level.
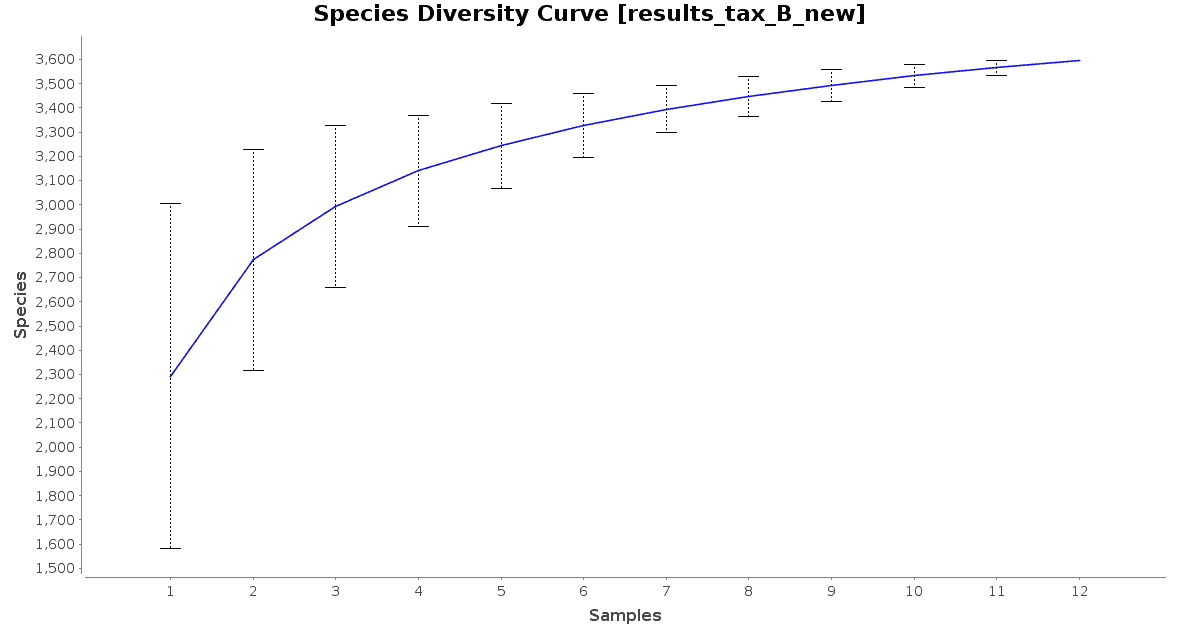
Figure 3. Species Accumulation Curve.
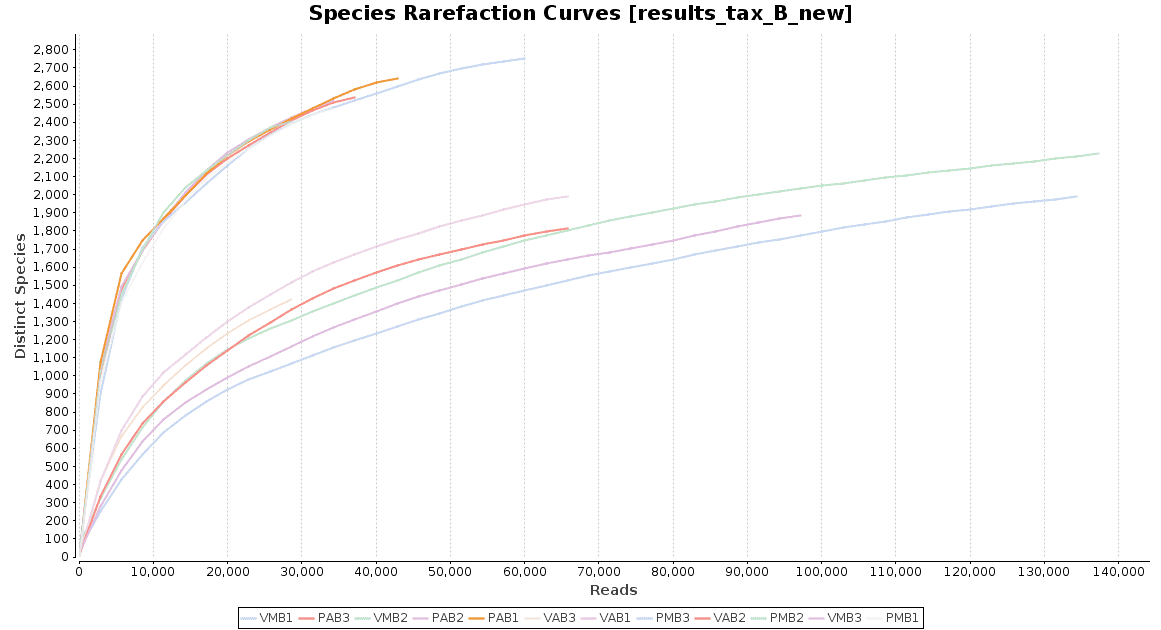
Figure 4. Rarefaction Curves.
The accumulation curve suggested that the number of samples was adequate to obtain a good image of the whole environment, and the effect of adding more samples to the dataset would not contribute to obtain a better representation. However, the rarefaction curves suggest us that maybe the sequencing depth was not enough to cover all the species present in these environments, specially in the case of Preta lake samples, which presented a much higher level of microbial diversity.
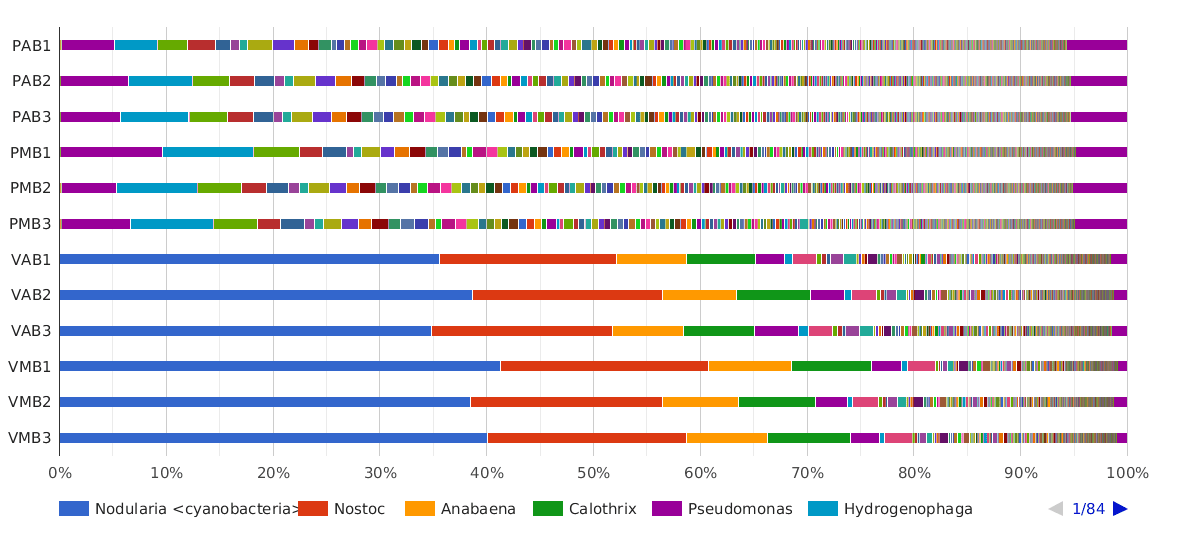
Figure 5. Taxonomic Classification bar chart by Genus.
The main cyanobacterial genus in Salina Verde was Nodularia (40%), a filamentous nitrogen-fixing group of cyanobacteria, commonly associated with algae bloom events in salinic water systems. Other cyanobacterial genera found in Salina Verde were Nostoc, Calothrix, Anabaena and Fischerella. None of them was found in significant abundances in Salina Preta.
The dominant genera found in Salina Preta were Pseudomonas (7%), Hydrogenophaga (4%), Acidovorax (3%) and Burkholderia (3%).
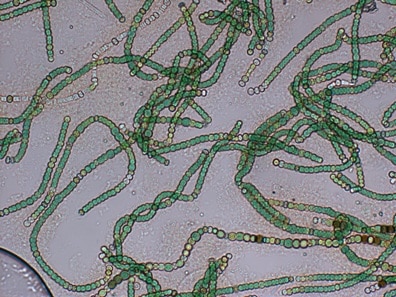
Figure 6. Nodularia spumigena (source: Biological and Satellite Oceanography Laboratory, http://oceandatacenter.ucsc.edu/).
To get a better understanding of the taxonomic differences between lakes, a differential abundance test (Metagenomics > Comparative Analysis > OTU Differential Abundance Testing) was performed in OmicsBox. We used the Verde lake samples as contrast group and the Preta lake samples as reference group. The test was performed at genus level.
A heatmap showing the 10 first differentially abundant genera, ordered by the FDR after the test, was also generated. As expected, this graph showed that the most abundant genera in Verde lake when comparing it to Preta lake corresponded to cyanobacteria (Nostoc, Nodularia, Calothrix, …). In addition, the hierarchical clustering among samples showed what the PCoA already revealed before: both lakes are taxonomically different from each other, but there is not a clear separation between the sampling times, even within a single lake.
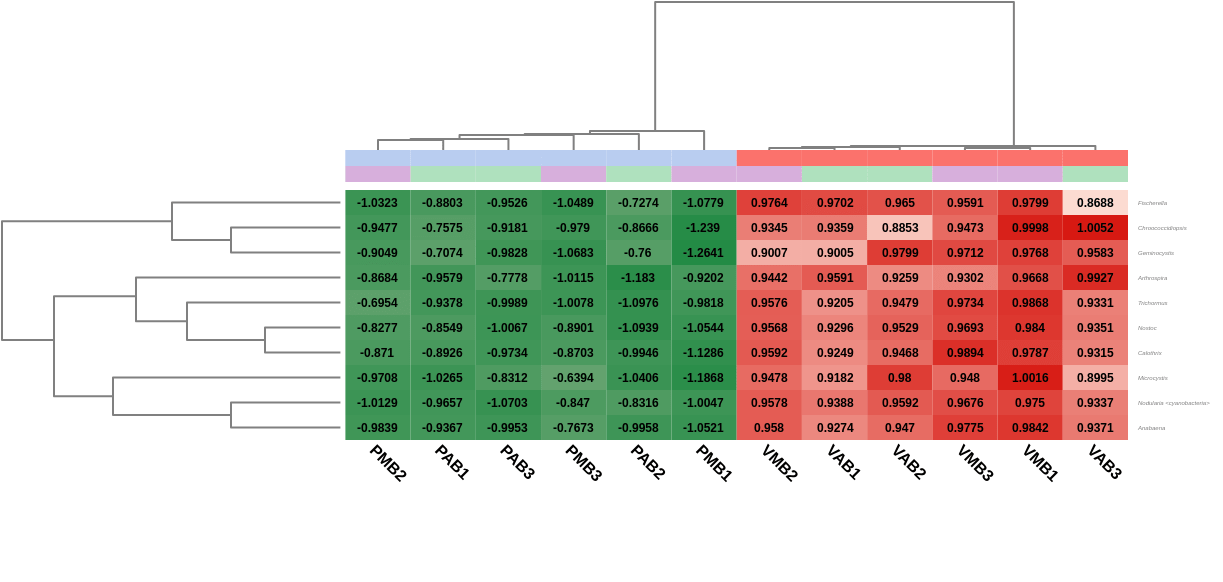
Figure 7. Heatmap showing Salina Preta samples in blue on the left and Salina Verde in red on the right.
OmicsBox also allows visualizing the taxonomic classification in an interactive manner with Krona charts, in which the different taxonomies are displayed hierarchically in a radial cladogram. This kind of graphs makes it easier to compare samples with each other.
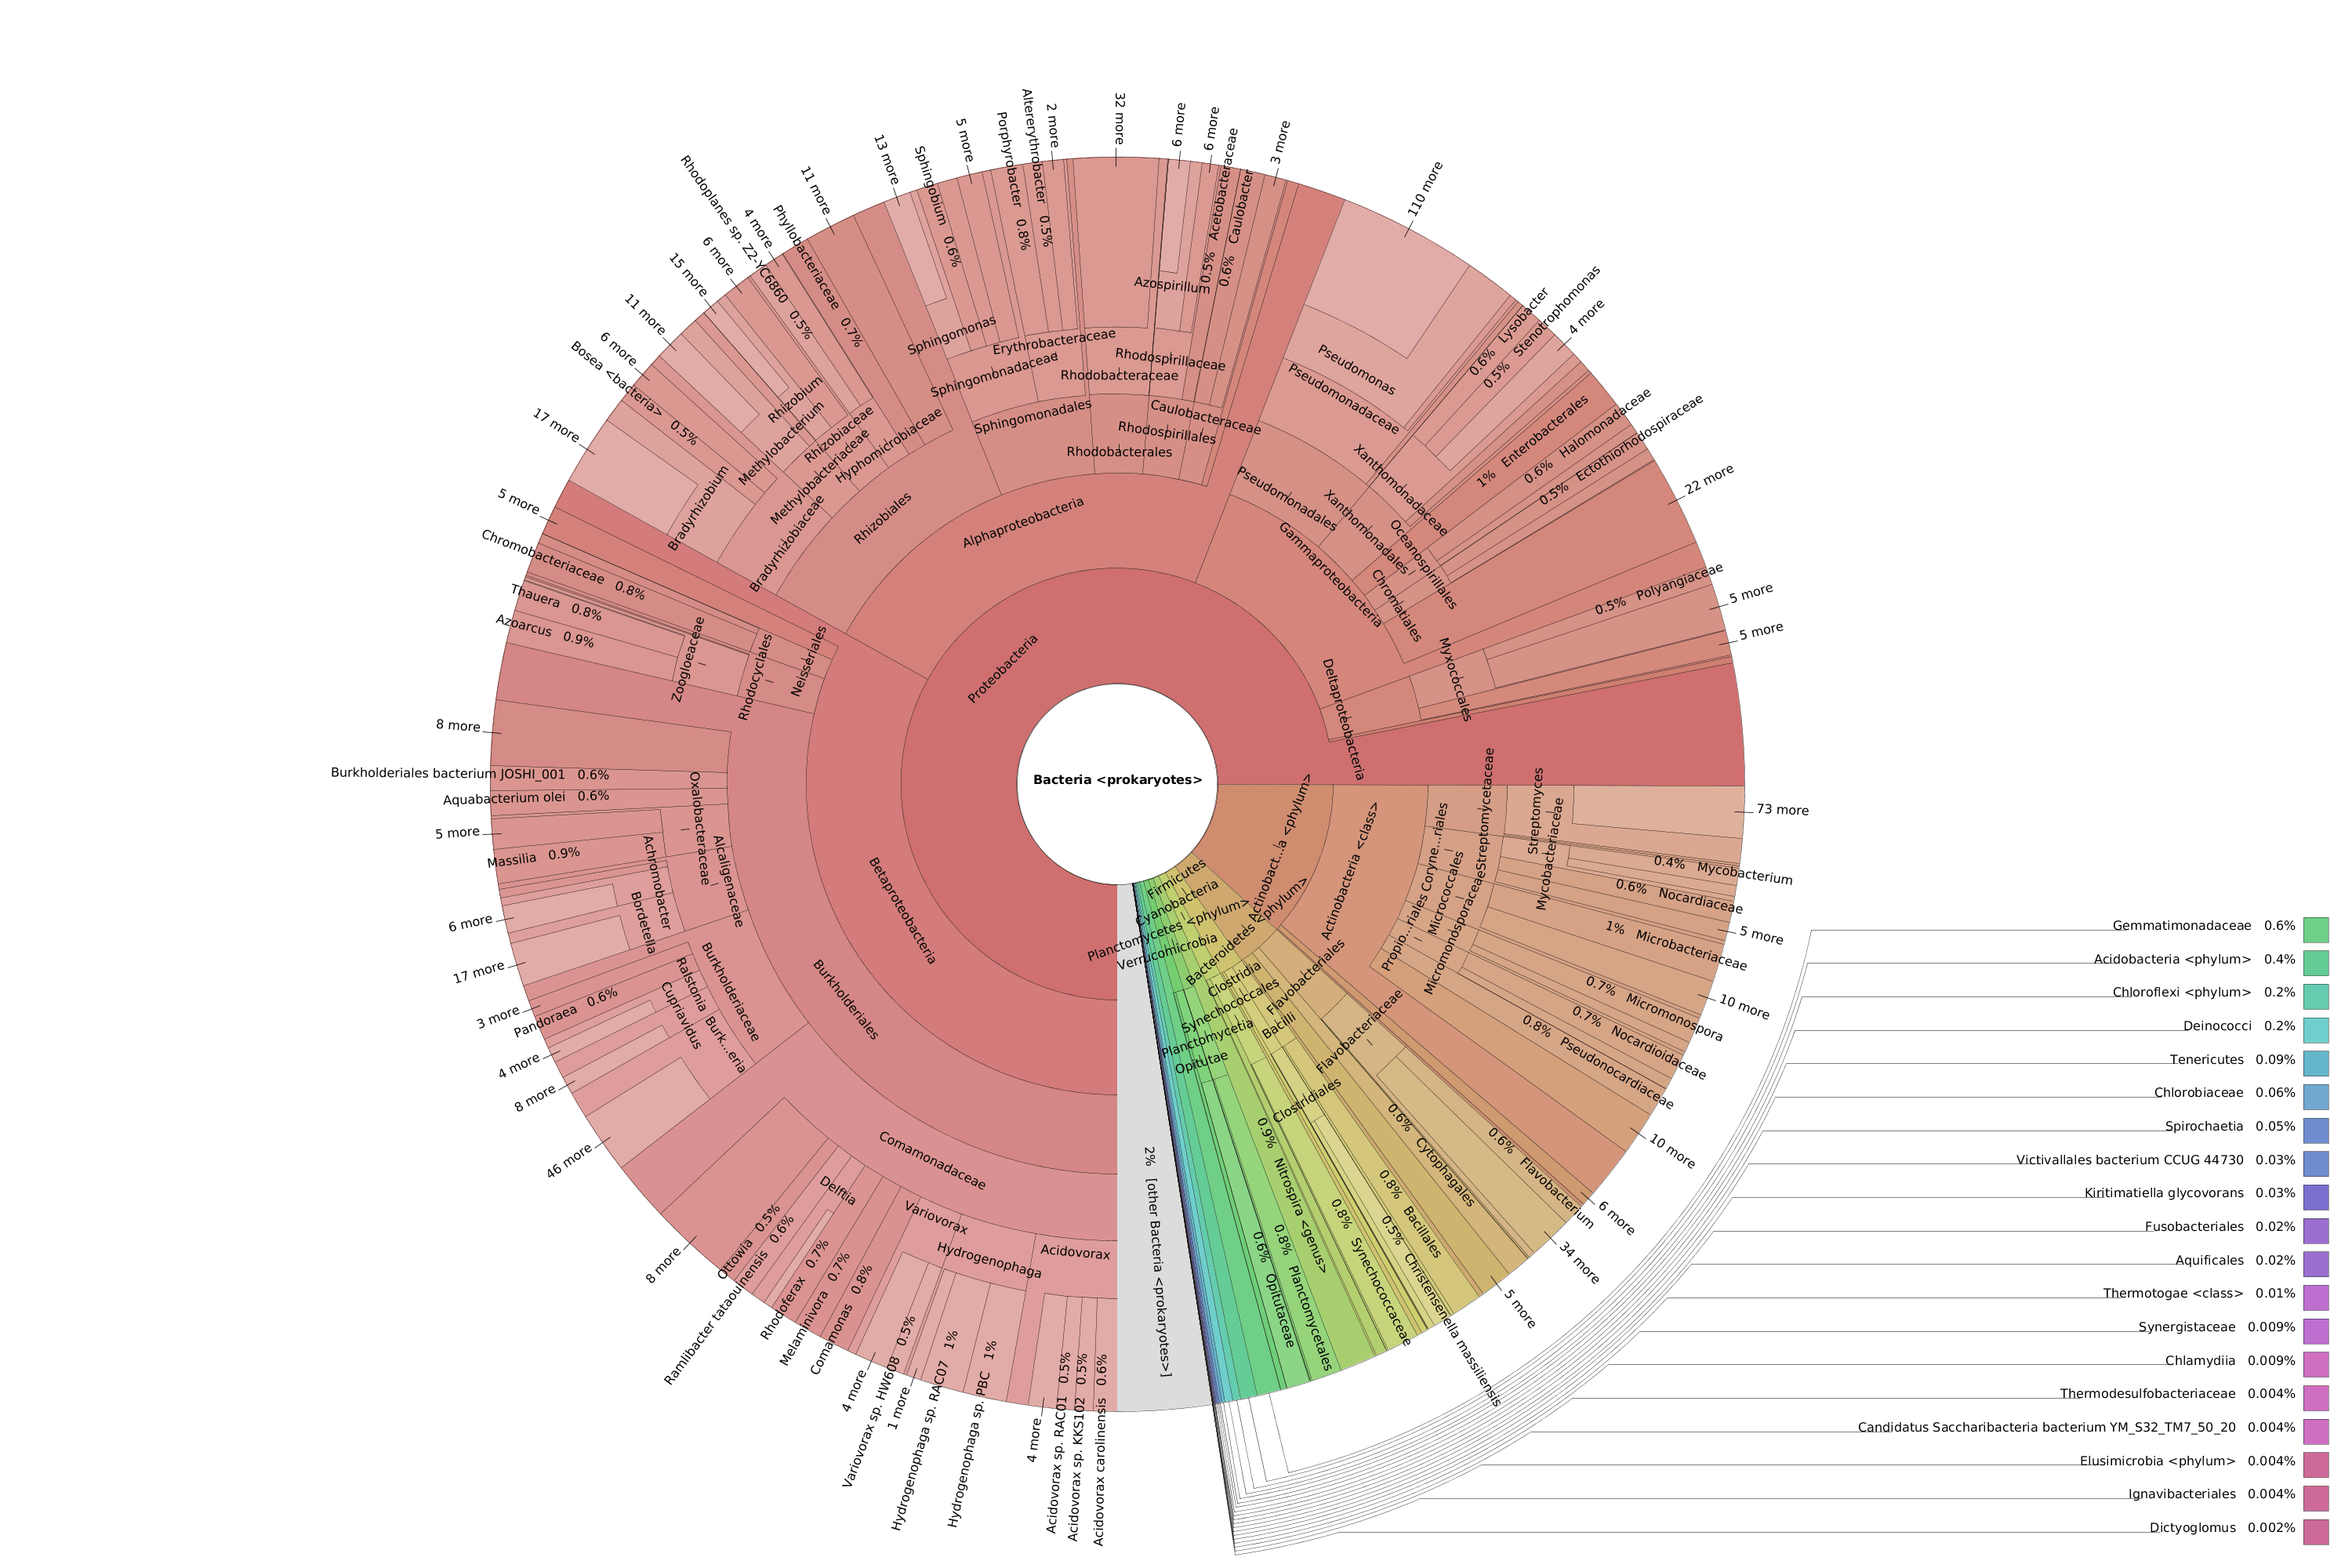
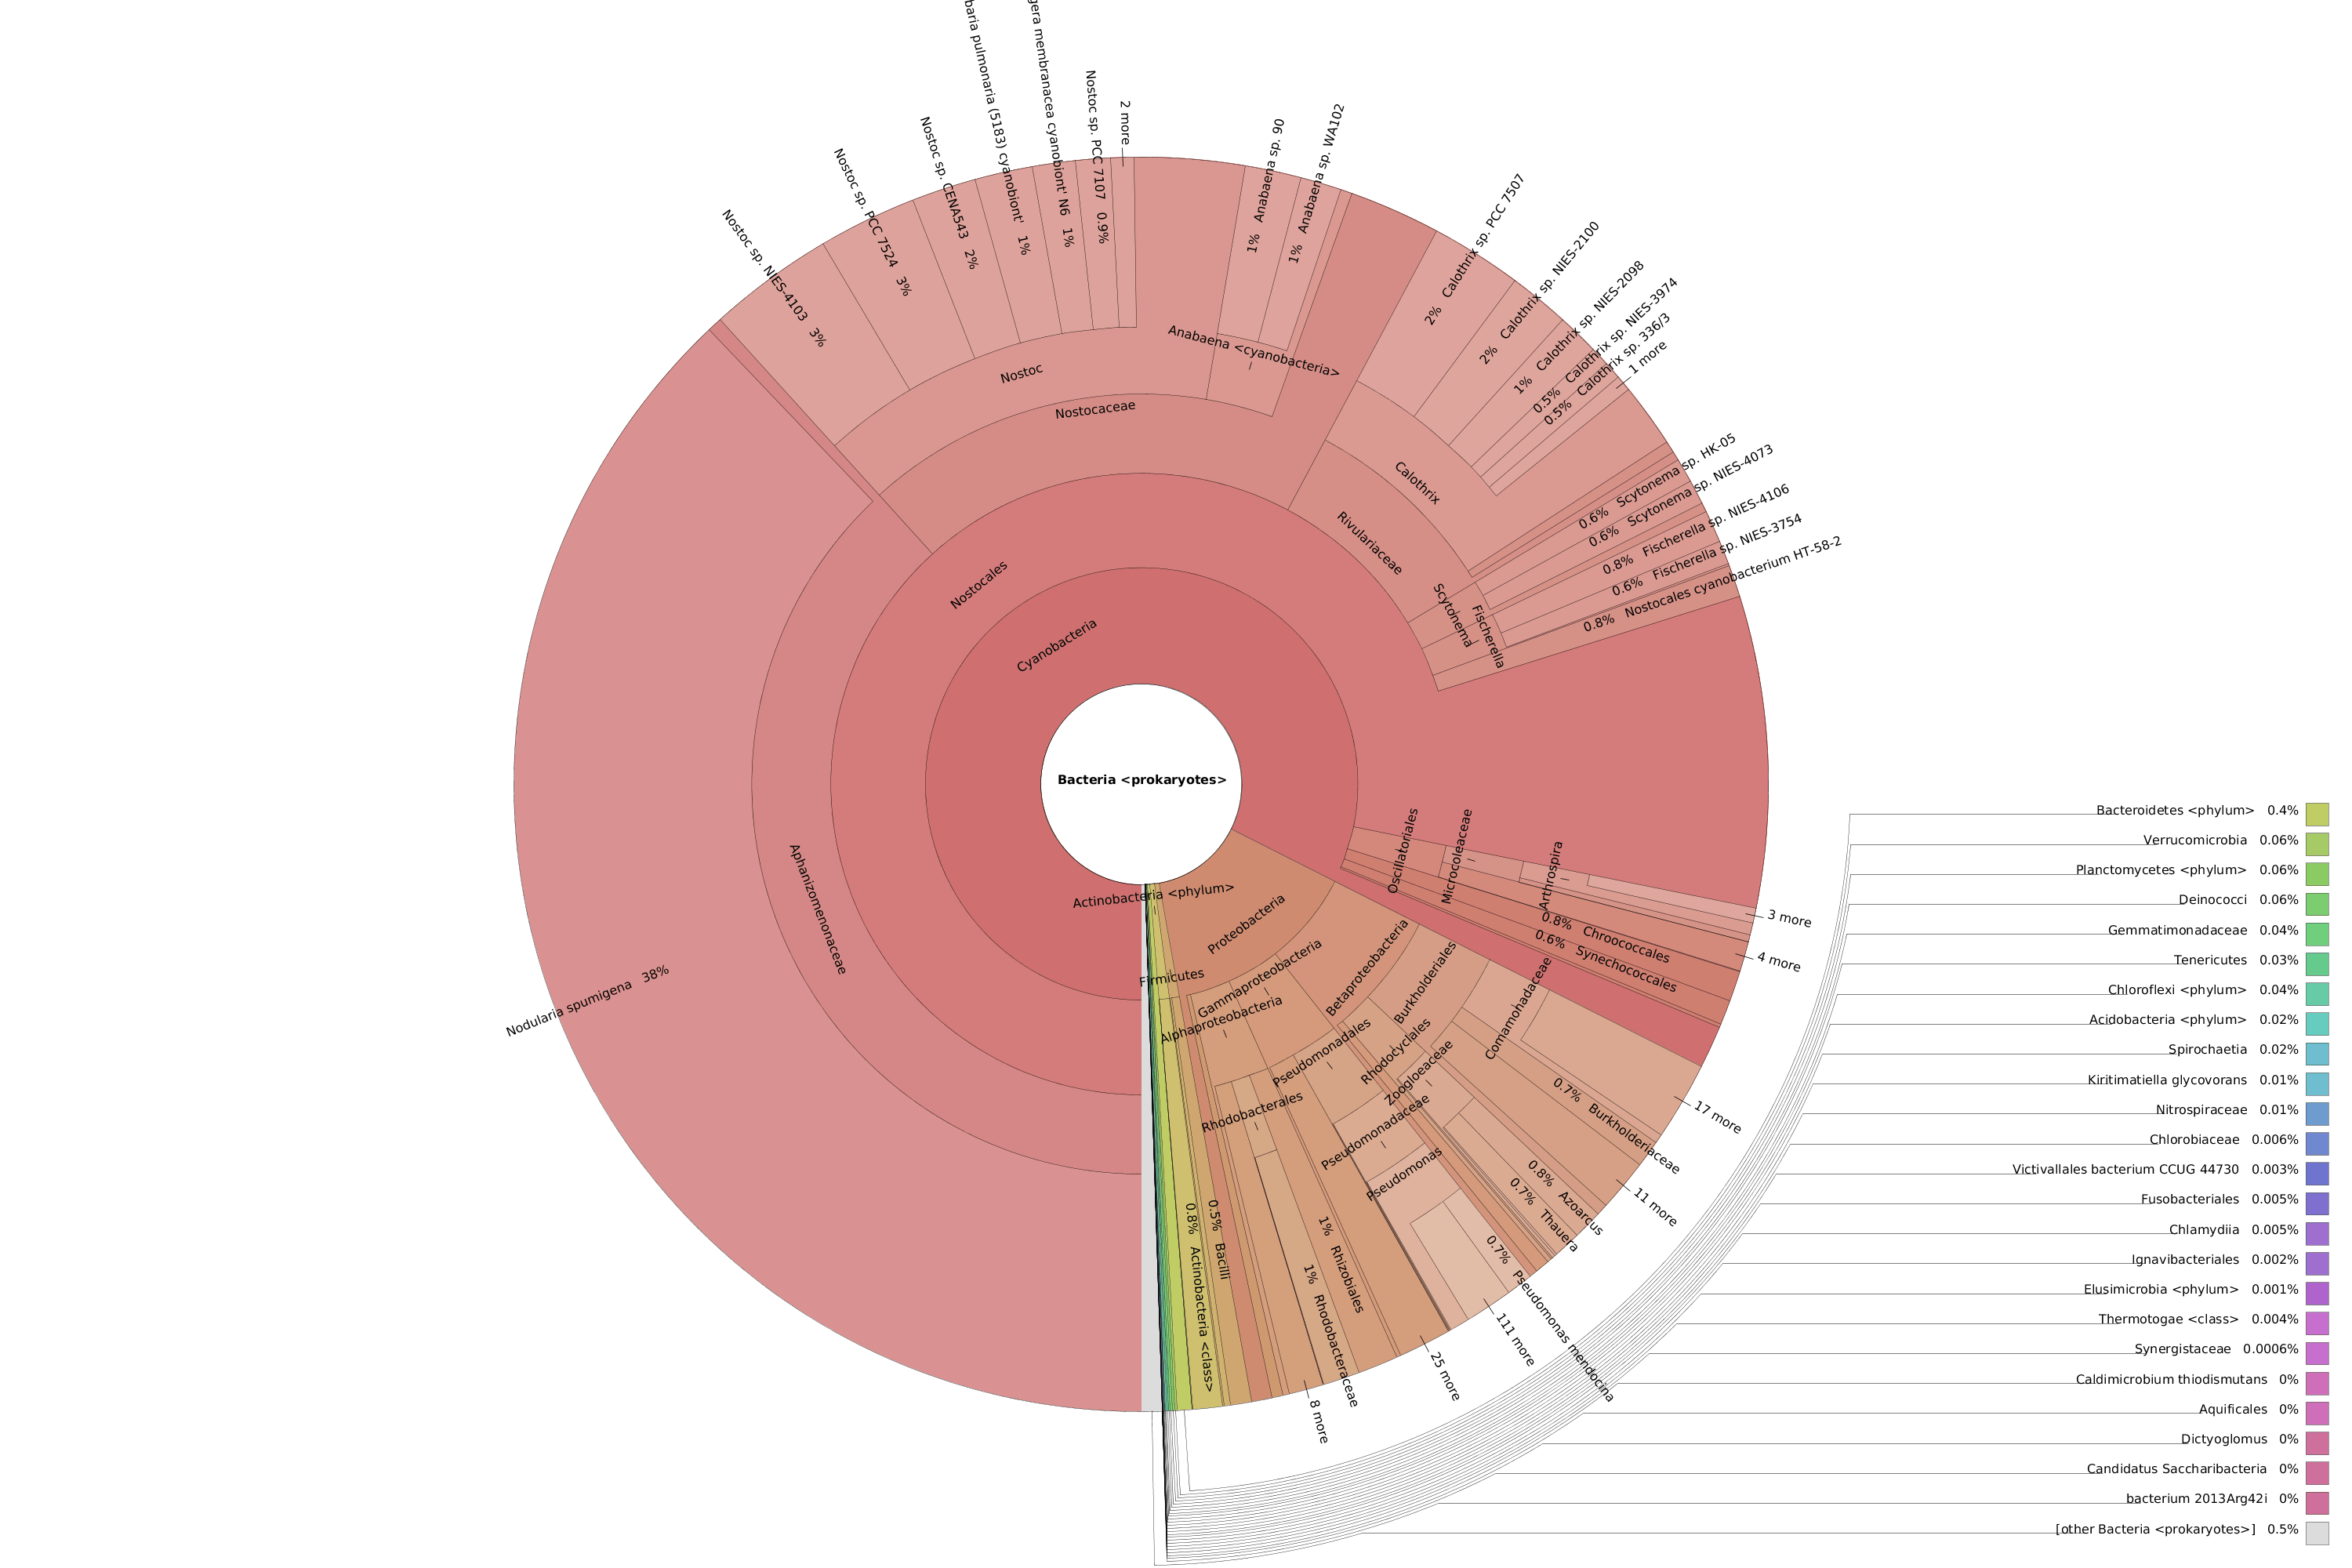
Figure 8. Krona chart comparison between PAB (left) and VAB (right).
4. Functional Characterization
4.1. Assembly and Gene Finding
After comparing the taxonomic compositions, we decided to perform a functional characterization to describe the divergences in metabolism of both microbial communities.
For that purpose, we used MEGAHIT (Metagenomics > Metagenomic Assembly > MEGAHIT) to assemble each sample, and we used FragGeneScan (Metagenomics > Metagenomic Gene Prediction > FragGeneScan) to find genes and gene fragments in each assembly.
| PAB | PMB | VAB | VMB | ||
| Assembly | N. contigs | 13363 | 16607 | 7399 | 8727 |
| N50 | 691 | 717 | 884 | 936 | |
| Gene Finding | Predicted genes | 71557 | 76640 | 42880 | 59839 |
| Avg. gene length (nt) | 389.79 | 404.66 | 394.01 | 381.19 |
4.2. Functional Annotation
The predicted genes were functionally annotated in three different ways: with PfamScan, EggNOG Mapper (Metagenomics > Annotation Tools) and Blast2GO methodology. The Blast2GO annotation was performed by using CloudBlast with BlastP against the NCBI nr (non-redundant) database (Functional Analysis > Blast) using the amino acid sequences from the gene finding step as queries, and the GO Mapping (Functional Analysis > Blast2GO Mapping) and the GO Annotation (Functional Analysis > Blast2GO Annotation) steps were executed with default parameters.
As BlastP was performed against the nr database, we decided to check the Top-Hit Species Distribution. When comparing these species to the species found in the initial taxonomic classification, both results were very similar.
In Salina Verde, the Genus Nodularia represents the first four top-hit species. In particular, N. spumigena is the principal species found, which coincides with the Krona chart information.
In Salina Preta, Acidobacteria or Hydrogenophaga are present in the top-hit species and in the taxonomic classification graphs.
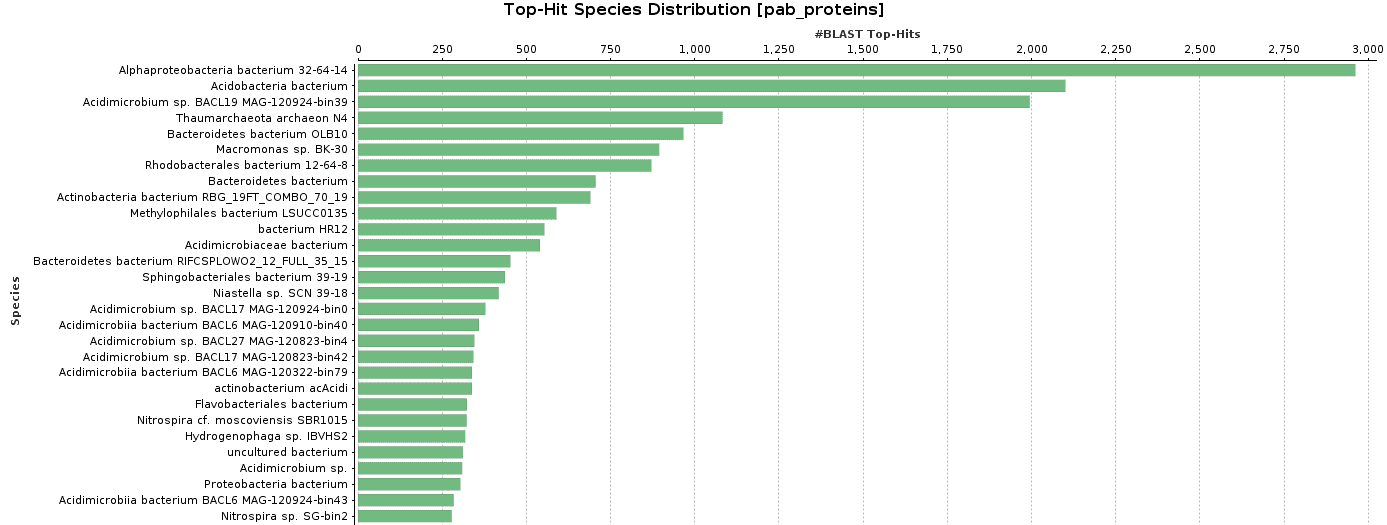
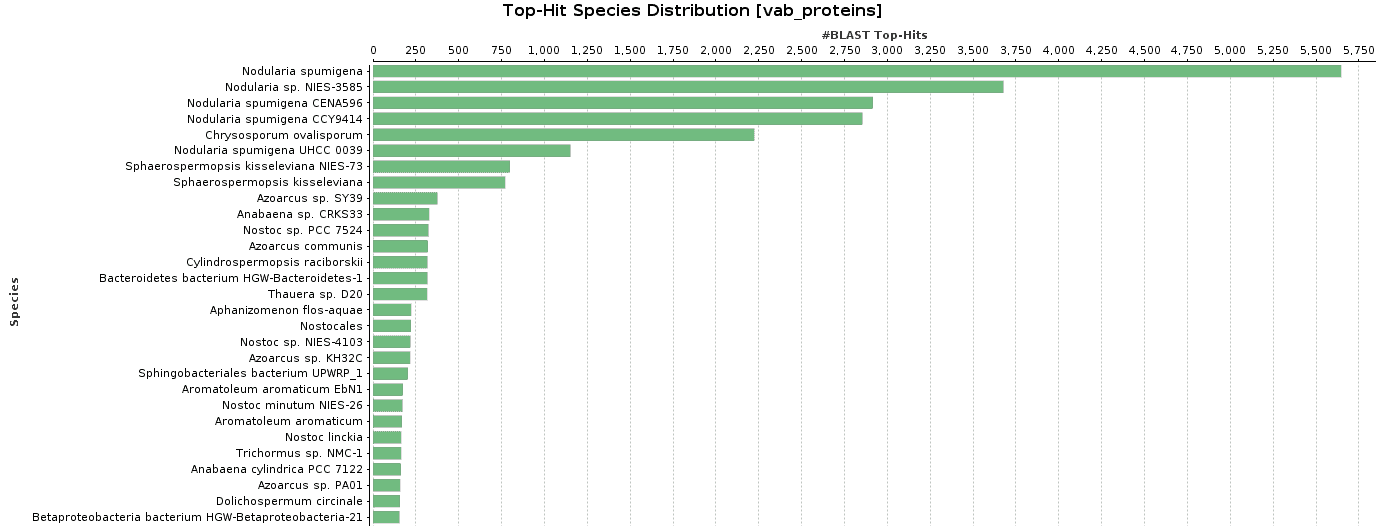
Figure 9. Top-Hit Species Distribution charts: PAB and VAB samples.
Each annotation approach generates different GO terms, so we merged all the information for each sample. After this step, we had four annotations, one per sample. The functional analysis results are summarized here:
| PAB | PMB | VAB | VMB | ||
| Predicted genes | 71557 | 76640 | 42880 | 59839 | |
| EggNOG | Ann. genes | 18075 | 19318 | 9333 | 14379 |
| % annot. | 25.26% | 25.21% | 21.77% | 24.03% | |
| PfamScan | F. structures | 31651 | 36285 | 15195 | 34736 |
| % charact. | 44.23% | 47.34% | 35.44% | 58.04% | |
| Blast2GO | Ann. genes | 48061 | 55372 | 27291 | 35725 |
| % annot. | 67.16% | 72.25% | 63.65% | 59.70% | |
| FINAL | Ann. genes | 66139 | 74694 | 36628 | 50123 |
| % annot. | 92.43% | 97.46% | 85.42% | 83.76% | |
Finally, we obtained a sample comparison chart (Metagenomics > Comparative Analysis > Sample Comparison Chart) with the final annotations to examine and compare the functional composition of each lake.
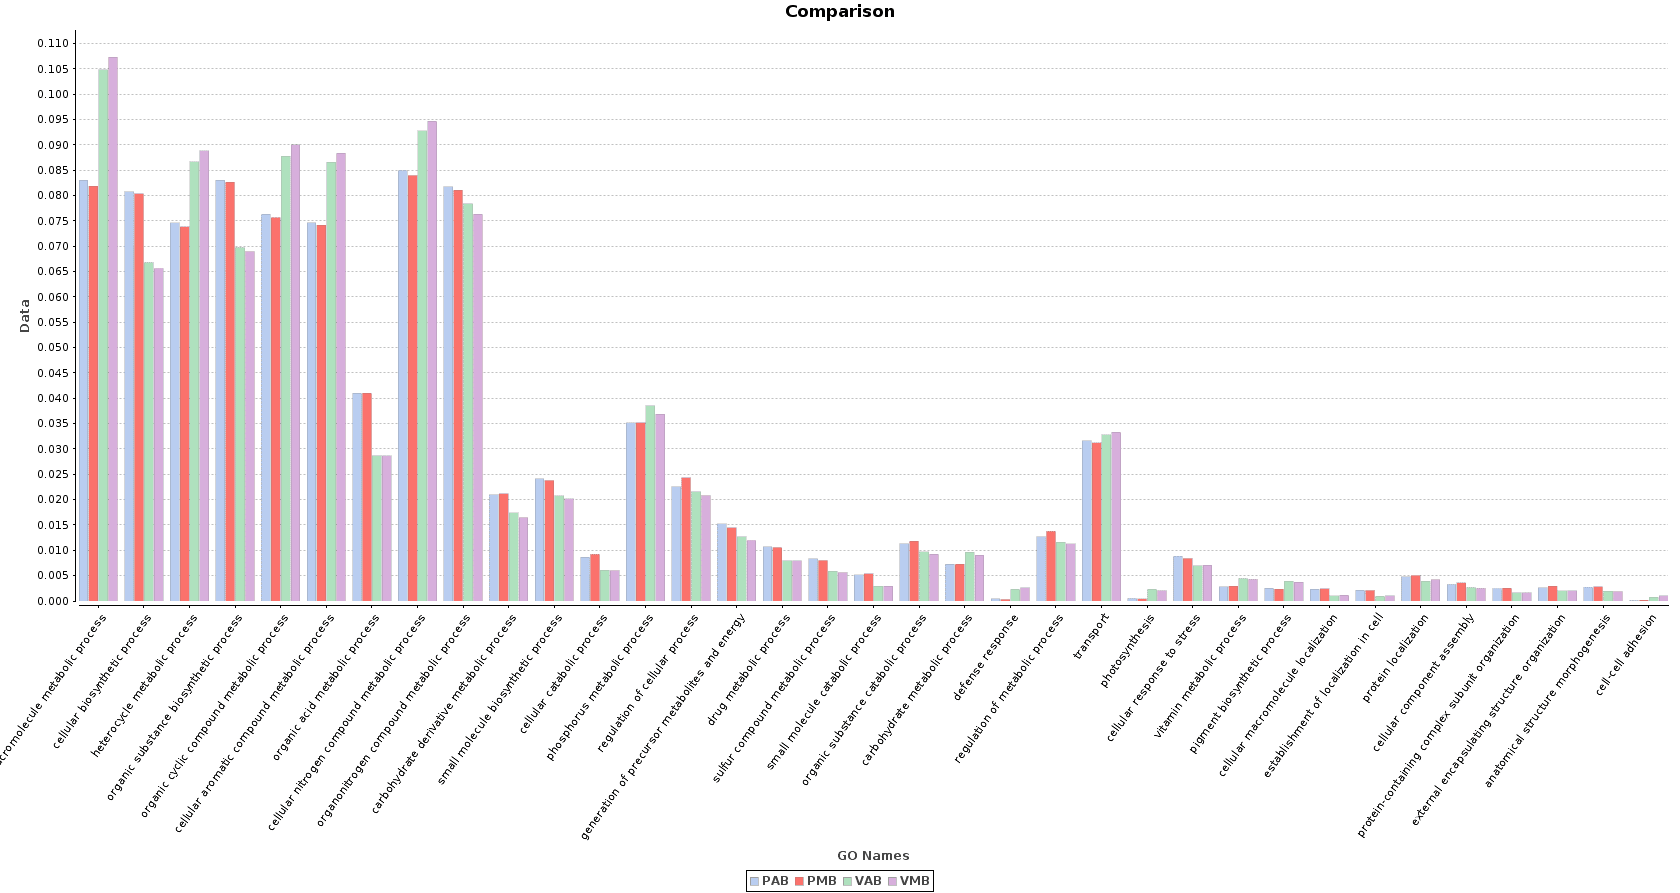
Figure 10. Sample Comparison Chart.
In the Salina Verde metagenome, functions related to photosynthesis (and photosynthesis itself) were especially abundant: macromolecule metabolism, phosphorus metabolism or pigment biosynthesis. Some Cyanobacteria species had the ability to fix the environmental nitrogen (N. spumigena or Anabaena), and therefore functions like cellular nitrogen compound metabolism are also abundant.
The above mentioned functions were less abundant in Salina Preta. Here, functions related to the use of organic acids as substrates are notably important because of the presence of organisms like Acidovorax. Other functions like response to stress or sulfur compound metabolic process are strongly represented in this lake due to the metabolism of this community.
5. Measured times and Cloud Units consumption
- Taxonomic classification: 15 min per sample
- Metagenomic assembly: 5 min per sample
- Gene prediction: 10 min per sample
- Functional Annotation
- PfamScan: 30 min per sample
- EggNOG-Mapper: 2 hours per sample
- BlastP against NR: between 1 and 5.5 hours per sample (1.5M Cloud Units in total)
The measured times are provided as maximum times per sample because the analysis can be run in parallel on all 4 samples at the same time. The workflow depicted in figure 7 shows part of the analysis that was run on each sample. Taking advantage of concurrent processing for all 4 samples, we can complete the whole analysis in around 6 hours. Measured times of course depend on samples sizes when applied to different data.
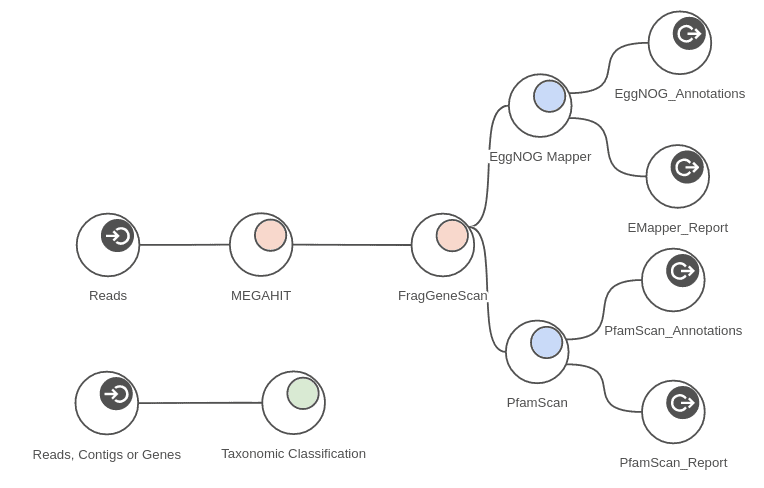
Figure 11. Complete metagenomics workflow.
6. Conclusions
- Our metagenomic analysis with OmicsBox allowed us to identify the microbial communities living in the lakes and to measure their functional genetic potential.
- Both taxonomic and functional compositions of Salina Preta and Salina Verde were very different, mainly because of the cyanobacterial blooms which occur in Salina Verde.
- Some organisms in Salina Verde had the potential to carry out photosynthesis and nitrogen-fixation processes. These functions are not important in Salina Preta lake.
7. References
- OmicsBox – Bioinformatics made easy. BioBam Bioinformatics. March 3, 2019. www.biobam.com/omicsbox.
- Andreote Ana P. D., Dini-Andreote Francisco, Rigonato Janaina, Machineski Gabriela Silva, Souza Bruno C. E., Barbiero Laurent, Rezende-Filho Ary T., Fiore Marli F. (2018). Contrasting the Genetic Patterns of Microbial Communities in Soda Lakes with and without Cyanobacterial Bloom. Frontiers in Microbiology, 9, doi: 10.3389/fmicb.2018.00244.
- Conesa A., Götz S., Garcia-Gomez JM., Terol J., Talon M. and Robles M. (2005). Blast2GO: a universal tool for annotation, visualization and analysis in functional genomics research. Bioinformatics (Oxford, England), 21(18), 3674-6.
- Conesa A. and Götz S. (2008). Blast2GO: A comprehensive suite for functional analysis in plant genomics. International journal of plant genomics, 2008, 619832.
- Götz S., Garcia-Gomez JM., Terol J., Williams TD., Nagaraj SH., Nueda MJ., Robles M., Talon M., Dopazo J. and Conesa A. (2008). High-throughput functional annotation and data mining with the Blast2GO suite. Nucleic acids research, 36(10), 3420-35.
- Huerta-Cepas J., Forslund K., Coelho LP., Szklarczyk D., Jensen LJ., von Mering C. and Bork P. (2017). Fast Genome-Wide Functional Annotation through Orthology Assignment by eggNOG-Mapper. Molecular biology and evolution, 34(8), 2115-2122.
- Langmead B. and Salzberg SL. (2012). Fast gapped-read alignment with Bowtie 2. Nature methods, 9(4), 357-9.
- Li D., Liu CM., Luo R., Sadakane K. and Lam TW. (2015). MEGAHIT: an ultra-fast single-node solution for large and complex metagenomics assembly via succinct de Bruijn graph. Bioinformatics (Oxford, England), 31(10), 1674-6.
- Li D., Luo R., Liu CM., Leung CM., Ting HF., Sadakane K., Yamashita H. and Lam TW. (2016). MEGAHIT v1.0: A fast and scalable metagenome assembler driven by advanced methodologies and community practices. Methods (San Diego, Calif.), 102, 3-11.
- Mistry J., Bateman A. and Finn RD. (2007). Predicting active site residue annotations in the Pfam database. BMC bioinformatics, 8, 298.
- Rho M., Tang H. and Ye Y. (2010). FragGeneScan: predicting genes in short and error-prone reads. Nucleic acids research, 38(20), e191.
- Wood DE. and Salzberg SL. (2014). Kraken: ultrafast metagenomic sequence classification using exact alignments. Genome biology, 15(3), R46.
For further information about how to perform metagenomics in OmicsBox, please consult the user manual.
")
