Introduction
Differential gene expression analysis is a fundamental step in the interpretation of RNA-seq data. It aims to identify genes whose expression levels change significantly between experimental conditions, such as treated versus control samples or different biological states. These changes provide insight into the molecular mechanisms underlying phenotypic differences, enabling the discovery of biomarkers, regulatory pathways, and functional responses to specific stimuli.
Among the available statistical methods, edgeR and DESeq2 are widely considered gold-standard approaches for differential expression analysis of count data. Both methods model read counts using the negative binomial distribution, which accounts for biological variability and overdispersion commonly observed in RNA-seq experiments.
EdgeR relies on empirical Bayes strategies for dispersion estimation and is particularly well-suited for small sample sizes, while DESeq2 incorporates shrinkage estimators for dispersion and fold changes, improving result stability, particularly for low-count genes. Although both methods are robust, differences may arise from their normalization procedures and statistical frameworks.
Despite their widespread use, applying these methods often requires programming expertise and careful data handling. OmicsBox addresses this limitation by providing an intuitive graphical environment that integrates differential expression analysis into a complete RNA-seq workflow, from raw data processing to biological interpretation. OmicsBox enables researchers without coding experience to perform advanced analyses while maintaining methodological rigor and reproducibility.
How to Run Differential Expression Analysis in OmicsBox
Differential expression analysis in OmicsBox is designed to be accessible while maintaining flexibility for different experimental designs.
The analysis requires a count matrix containing raw read counts per gene and sample, along with an experimental design file describing the conditions associated with each sample. These counts can be generated directly within OmicsBox using its RNA-seq Read Quantification tool, allowing users to start from raw sequencing data and proceed seamlessly to differential expression analysis. Alternatively, externally generated count tables can also be imported.
EdgeR configuration
For differential expression using edgeR, OmicsBox provides a structured configuration panel where users define the experimental design and statistical parameters. A key aspect of this setup is the selection of the “Design Type”, which determines how the model is constructed and what hypothesis is tested. The available design types include:
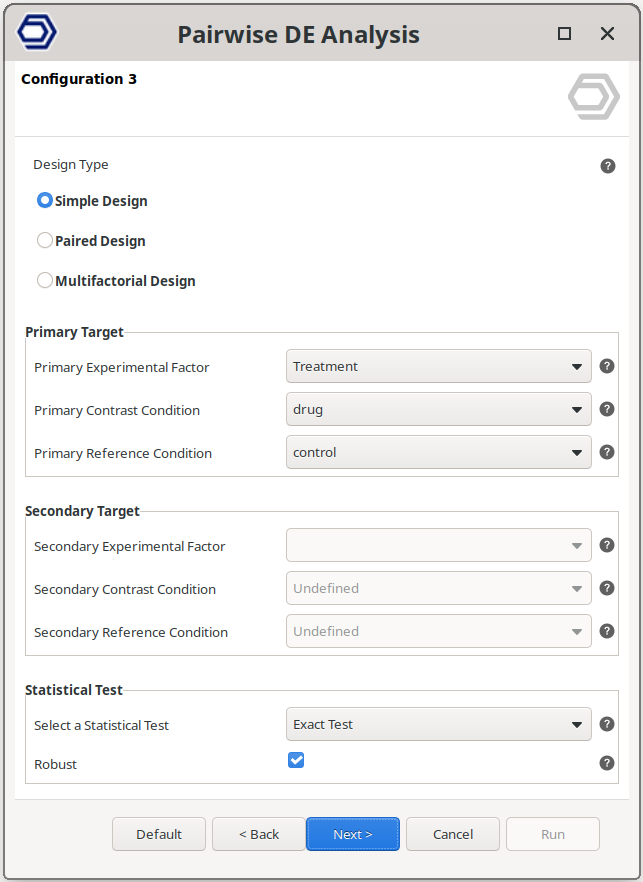
Simple Design
Perform a pairwise comparison between two independent conditions belonging to the same experimental factor.
This is the most common scenario, where the analysis tests for genes that are differentially expressed between groups, such as drug versus control samples.
The example configuration on the right will test the samples treated with the drug versus the control samples.
The factor to test is set via the “Primary Experimental Factor”, and the conditions are set with the “Primary Contrast Condition” and “Primary Reference Condition” parameters.

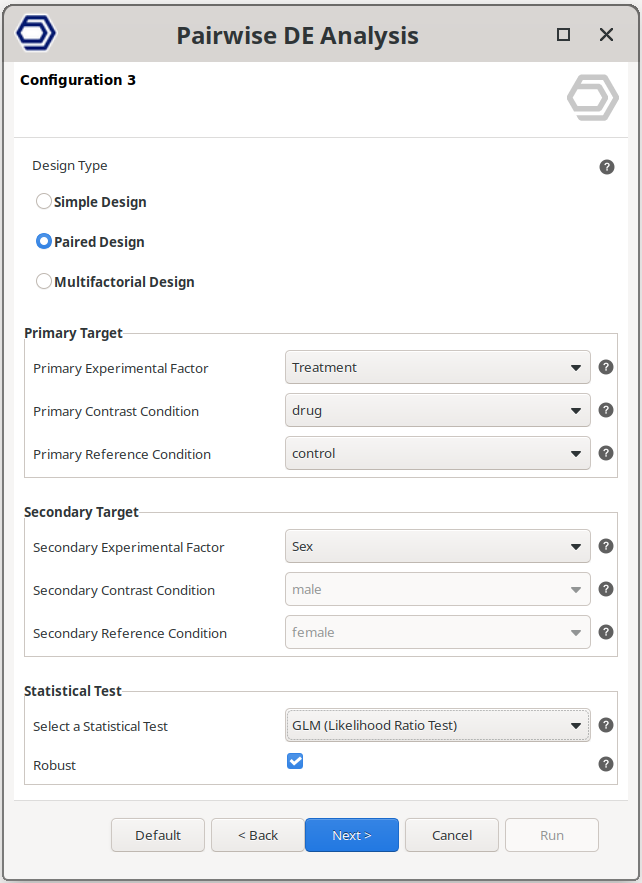
Paired Design
Perform a pairwise comparison between two conditions while correcting for variability introduced by an additional factor.
This corresponds to a blocking design, where samples are grouped (e.g., by subject, batch, or replicate group), and the analysis accounts for these baseline differences while still testing the effect of the main condition of interest.
For example, the configuration on the right will still test between drug and control samples, but correcting for baseline differences due to the sex condition.
The main test is configured as in the Simple Design, and the factor to use to correct the variability is set via the “Secondary Experimental Factor” parameter.

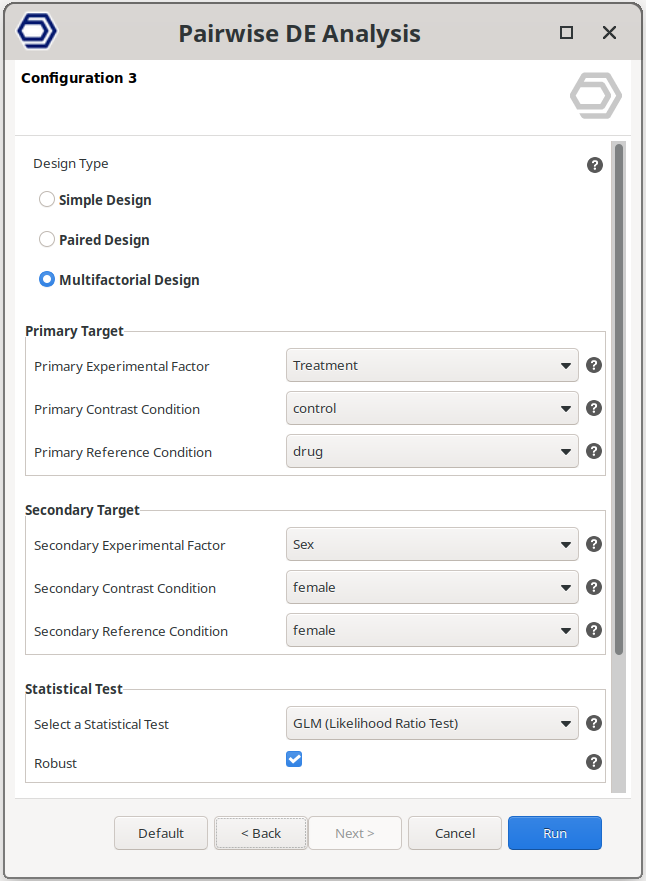
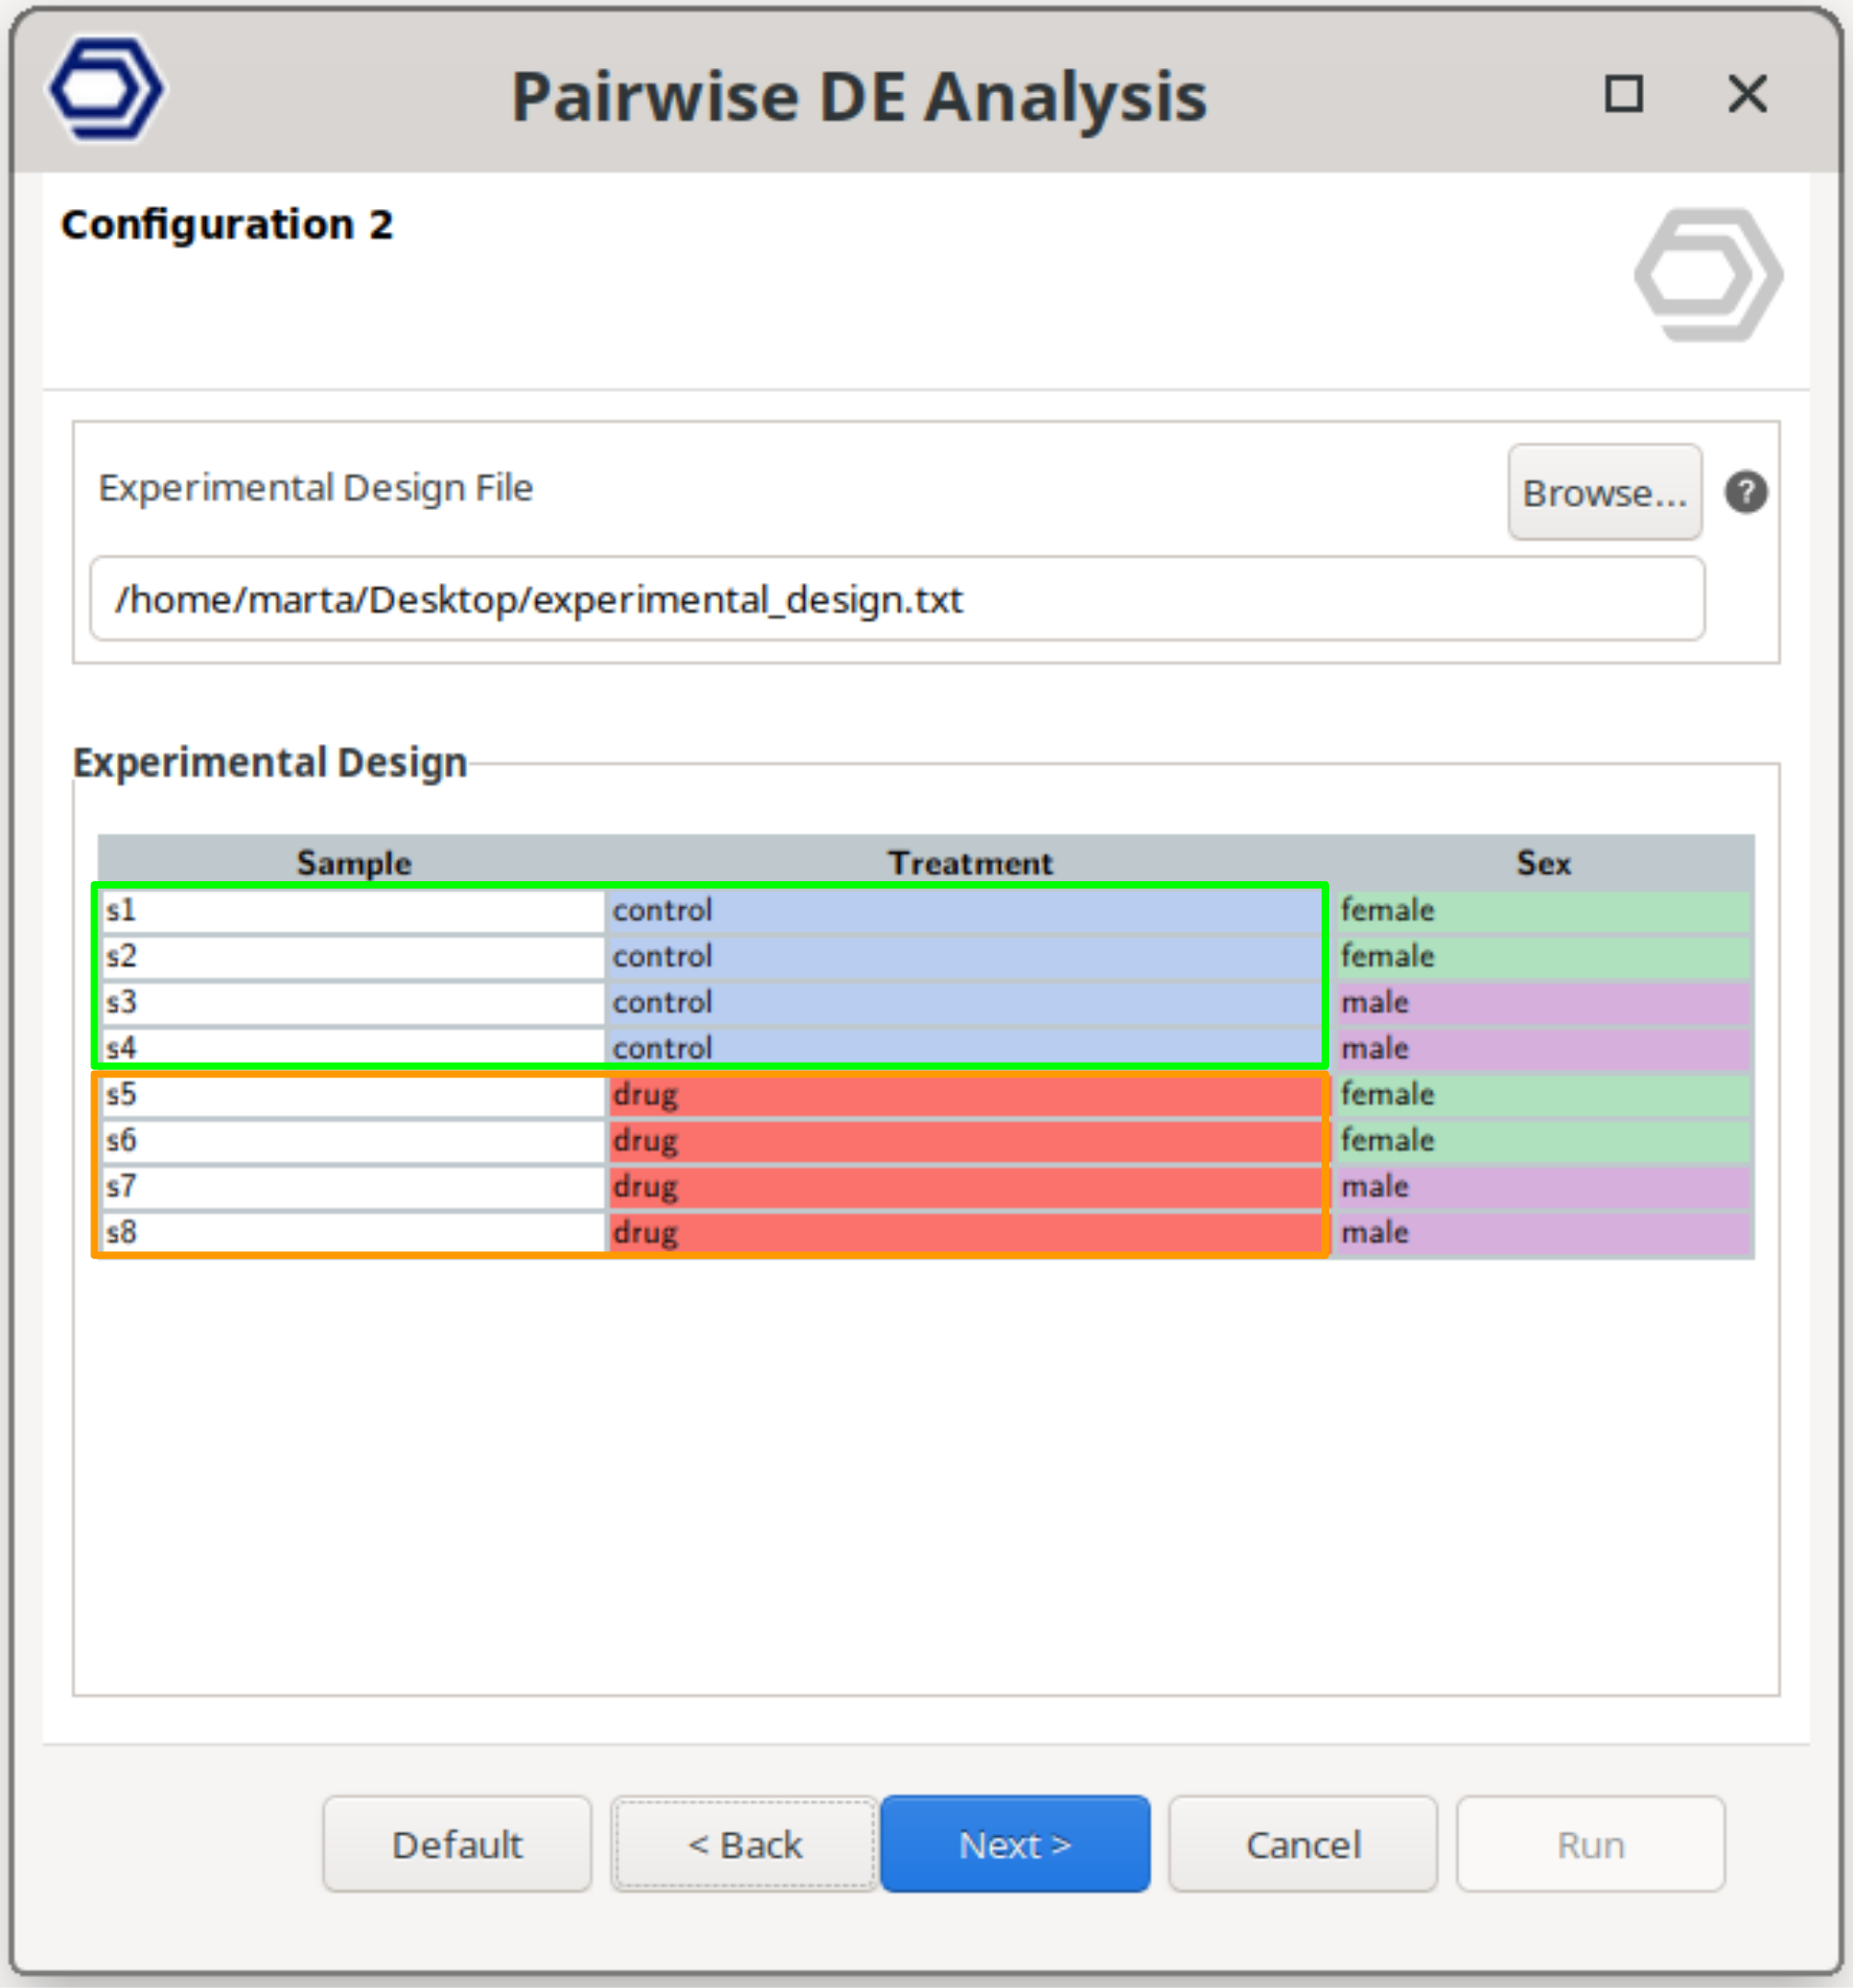
Multifactorial Design
Perform a pairwise comparison between samples belonging to a combination of two experimental factors.
The analysis then compares specific combinations of conditions, allowing the evaluation of gene expression changes associated with combined experimental conditions.
The example configuration on the right will test samples belonging to drug+female versus control+female. That is, the test will compare the effect of the drug only in female samples.
The test compares the samples belonging to the “Primary Contrast Condition” and “Secondary Contrast Condition” versus the samples belonging to the “Primary Reference Condition” and “Secondary Reference Condition”.

DESeq2 Configuration
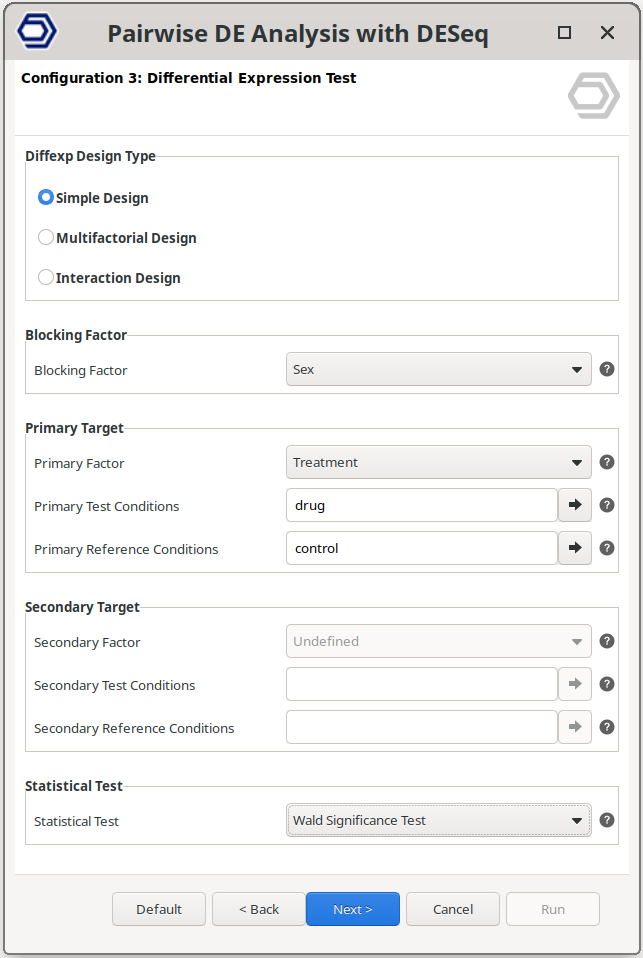
For differential expression using DESeq2, OmicsBox provides a guided configuration that mirrors the flexibility of the underlying statistical model while simplifying its application. Even though still similar, there are a few differences with respect to the edgeR configuration. One difference is that this tool allows the specification of a Blocking Factor for any design type. That is, it is possible to correct for undesired sources of variability for any comparison. With the edgeR tool, this could only be achieved with the Paired Design. Moreover, multiple conditions can be selected as Test or Reference, not just one. Finally, it includes a new design type, the Interaction Design.
Simple Design
Perform a pairwise comparison between two independent conditions from a single experimental factor. An additional blocking factor can also be selected.
The example configuration on the right will test the samples treated with the drug versus the control samples, but correcting for baseline differences due to the sex condition.
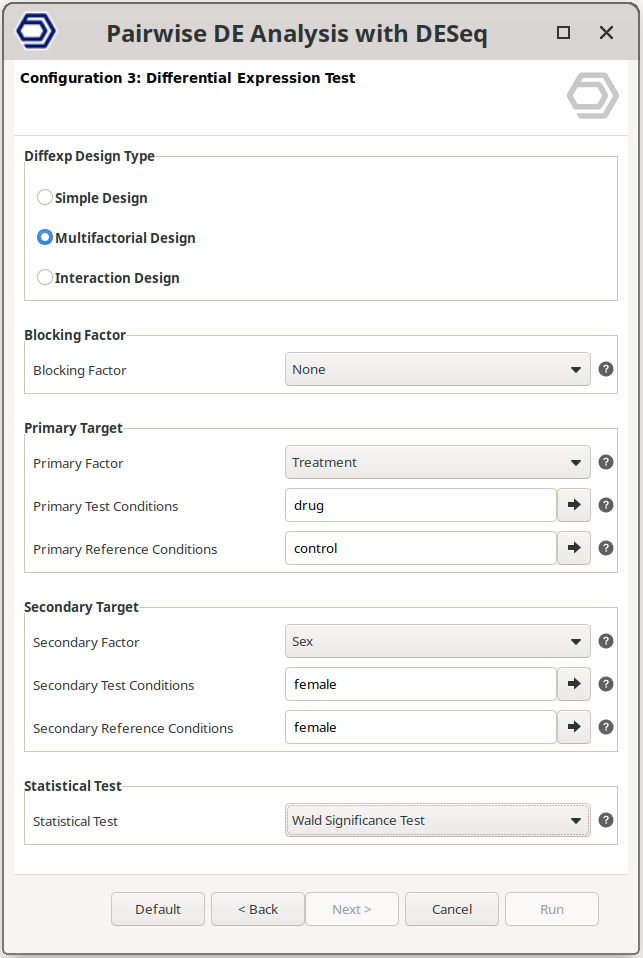
Multifactorial Design
Perform a pairwise comparison between samples defined by a combination of two experimental factors.
This design allows testing specific combinations of conditions by selecting two factors and defining the reference and contrast groups for each.
The example configuration on the right will test samples belonging to drug+female versus control+female. That is, the analysis evaluates the effect of the drug specifically within female samples, while still allowing inclusion of a blocking factor if required.

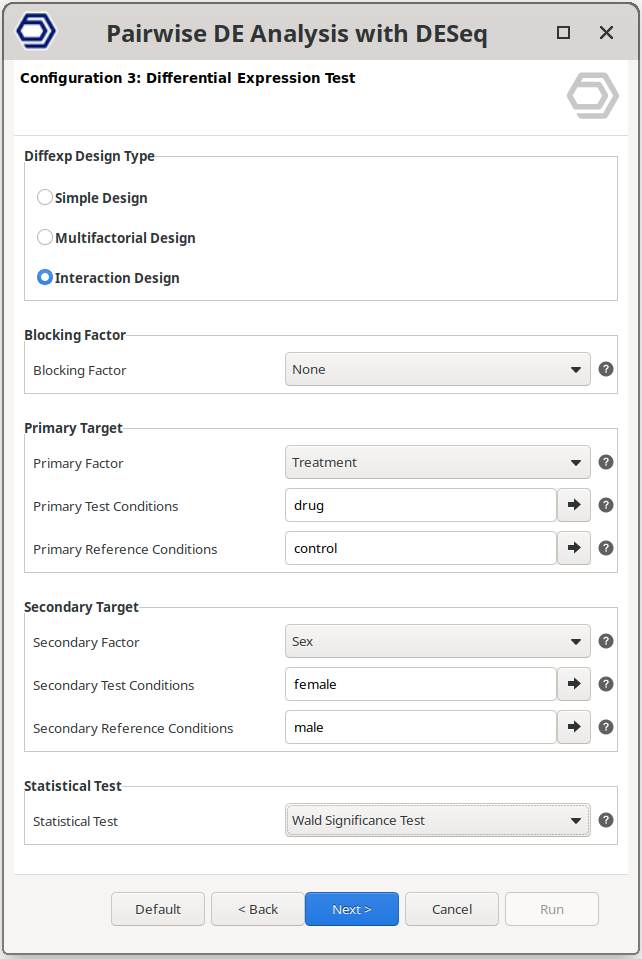
Interaction Design
Perform a pairwise comparison that evaluates whether the effect of one experimental factor depends on another factor.
In this design, the model includes an interaction term between the two selected factors, allowing the detection of genes whose response to one condition changes across the levels of the second factor. This corresponds to testing differences in effects rather than direct group comparisons, as commonly implemented in DESeq2 interaction models.
The example configuration on the right will test whether the effect of the drug differs between females and males. That is, it identifies genes for which the treatment response is significantly different depending on sex.

Differential Expression Outputs in OmicsBox
Both differential expression methods in OmicsBox provide a unified and interactive results environment that facilitates data exploration and biological interpretation.
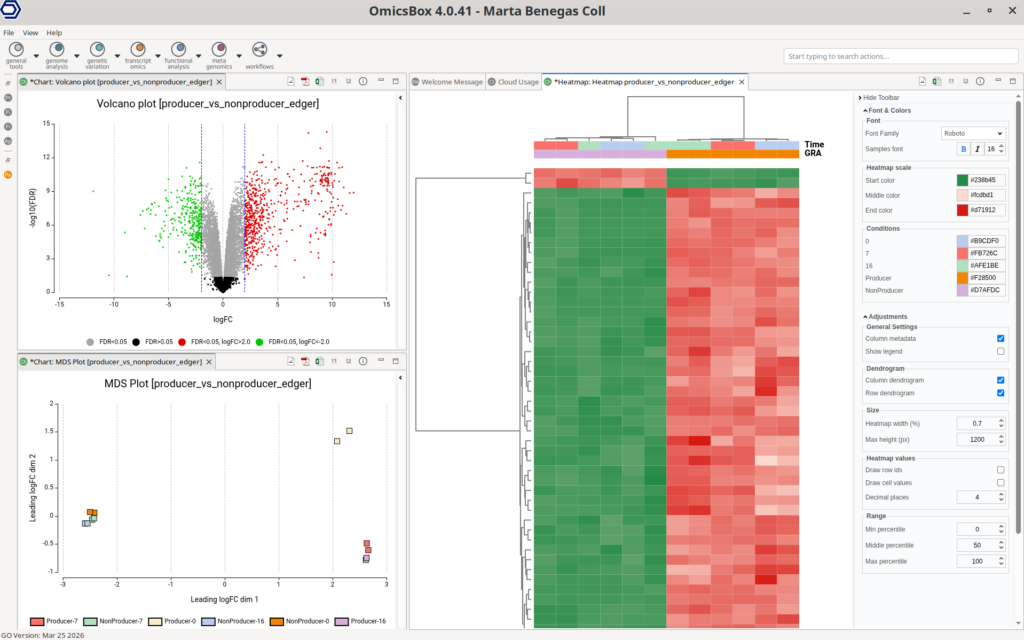
The main output is a results table where each row corresponds to a gene and includes key statistics such as log fold change, expression levels, and adjusted p-values (FDR). This table can be dynamically filtered, sorted, and subsetted based on statistical values or predefined tags. Genes are automatically labeled as up- or down-regulated according to selected cutoffs, and these thresholds can be modified in the Side Panel. Any change is immediately reflected across the table and associated visualizations, allowing users to iteratively refine their selection of relevant genes.
Visualization plays a central role in the interpretation of results. OmicsBox provides a range of commonly used plots, including volcano plots, MA plots, and multidimensional scaling (MDS) plots, enabling a global assessment of differential expression patterns. The volcano plot highlights the relationship between fold change and statistical significance, facilitating the identification of the most relevant genes.
Heatmaps offer a detailed view of expression patterns across samples. Users can select different gene subsets, such as the top differentially expressed genes or custom gene lists, and apply various data transformations. These include normalized counts and log-based or standardized transformations, allowing flexible visualization depending on the analysis goal.
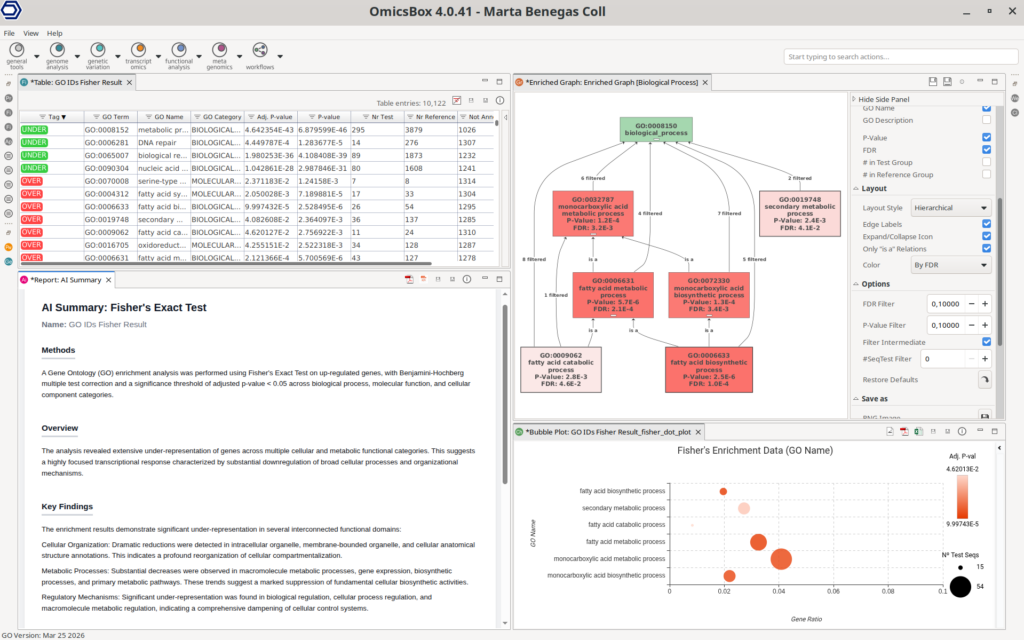
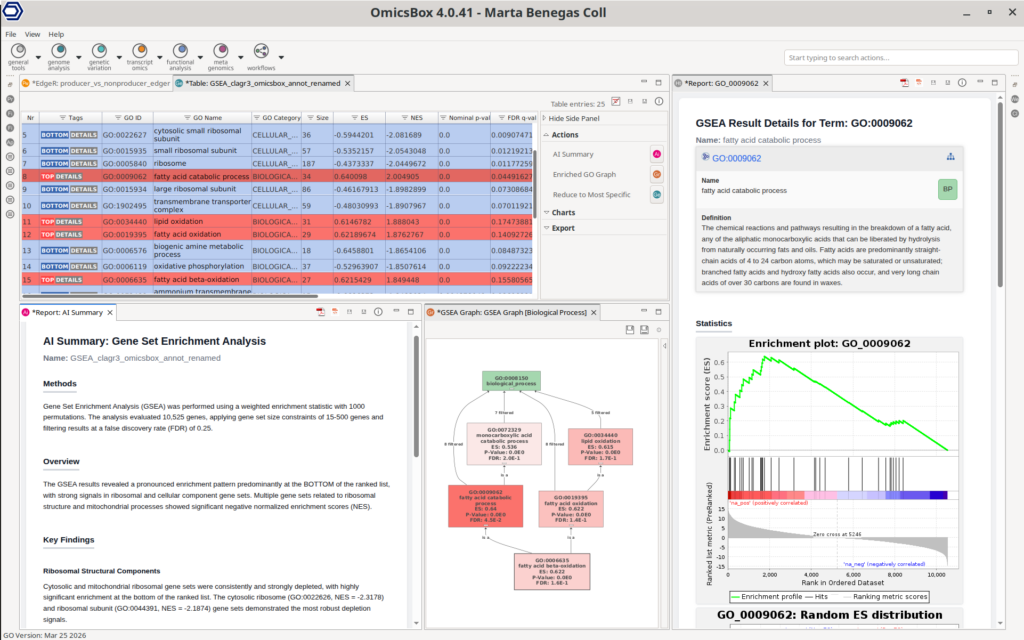
Importantly, differential expression results are directly connected to the functional enrichment, enabling seamless biological interpretation. Users can perform enrichment analyses such as Fisher’s Exact Test (FET) on subsets of up- or down-regulated genes, identifying overrepresented functional categories. In addition, Gene Set Enrichment Analysis (GSEA) can be applied to ranked gene lists to detect coordinated changes in predefined gene sets. This analysis requires a functional annotation of all the sequences in the dataset to use as a reference, which can be easily obtained with the OmicsBox’s Functional Analysis Module.
This integration of interactive visualization, flexible filtering, and downstream functional analysis allows users to move efficiently from raw statistical results to meaningful biological insights within a single environment.
Conclusion
Differential expression analysis in OmicsBox combines statistical rigor with ease of use, allowing researchers to apply gold-standard methods such as edgeR and DESeq2 without the need for programming. Through an intuitive interface, flexible experimental design configuration, and interactive result exploration, complex RNA-seq analyses become accessible and efficient.
Importantly, this analysis is part of a complete, end-to-end workflow within OmicsBox, covering all steps from raw sequencing data to functional interpretation. Beyond transcriptomics, the platform also supports multiple omics domains, including genomics, metagenomics, and genetic variation analysis.
In addition, OmicsBox leverages cloud-based computation, allowing users to perform resource-intensive analyses on standard laptops without requiring dedicated infrastructure.
Researchers interested in simplifying their bioinformatics workflows while maintaining analytical robustness are encouraged to explore the full capabilities of OmicsBox at the BioBam website.
About the Author
 Marta Benegas
Marta studied biotechnology at the Valencia Polytechnic University (UPV) and continued her studies with a Master's in Bioinformatics at the Autonomous University of Barcelona (UAB), Spain. After her master's degree, she started her professional career at Biobam where she is now working as a bioinformatics specialist and support manager. At the moment she is mainly focused on Single-Cell technologies developing various pipelines which allow getting from reads to functional insights at a single-cell resolution. These developments are available in OmicsBox, BioBam’s software solution.

