Establishing a high-quality de novo transcriptome is the first step for quantifying transcript abundance and mapping the biological pathways active in non-model species. For researchers working with non-model plants like Rorippa indica, a wild mustard known for its tolerance to the mustard aphid (Lipaphis erysimi), the challenge lies in turning millions of raw Illumina short reads into a biological insight without a reference genome.
In this blog, we will demonstrate a complete workflow using OmicsBox. We will reproduce the study by Bandopadhyay et al. (2024), moving from raw data preprocessing and quality control to de novo assembly, differential expression, and functional analysis.
Data
The dataset for this use case comes from a publication by Bandopadhyay et al. from 2024 titled “De novo transcriptome assembly and global analysis of differential gene expression of aphid tolerant wild mustard Rorippa indica (L.) Hiern infested by mustard aphid Lipaphis Erysimi (L.) Kaltenbach”. The raw sequencing data for this study is available in the NCBI Sequence Read Archive (SRA) under BioProject PRJNA792073 (accessions SRR17327159, SRR17327158, SRR17346649, and SRR17346648).
- Four samples of the wild mustard Rorippa indica were sequenced, representing two experimental conditions: uninfested (control) and aphid-infested plants.
- To ensure accuracy and biological representativeness, each of the two libraries per condition was prepared by pooling total RNA from three separate biological replicates.
- mRNA sequencing libraries were constructed using the NEB Ultra 2 RNA Library Prep Kit.
- The sequencing was performed on the Illumina HiSeq 2000 platform, generating 150 bp paired-end raw reads.
Phase 1: Data preprocessing
In a de novo assembly project, since we lack a reference genome to guide the assembly, any non-target sequence or low-quality base can lead to chimeric contigs or an artificially inflated transcriptome size. Thus, for the Rorippa indica dataset, we applied the following preprocessing workflow.
FASTQ Quality Check
The first step was an initial assessment using the FASTQ Quality Check (FastQC) tool. The per-base sequence quality profiles showed remarkably high Phred scores across all positions (Figure 1), suggesting the SRA data had undergone some level of prior filtering. However, we identified residual Illumina adapter sequences at the 3′ ends (Figure 2), which are notorious for causing assembly artifacts if not removed.
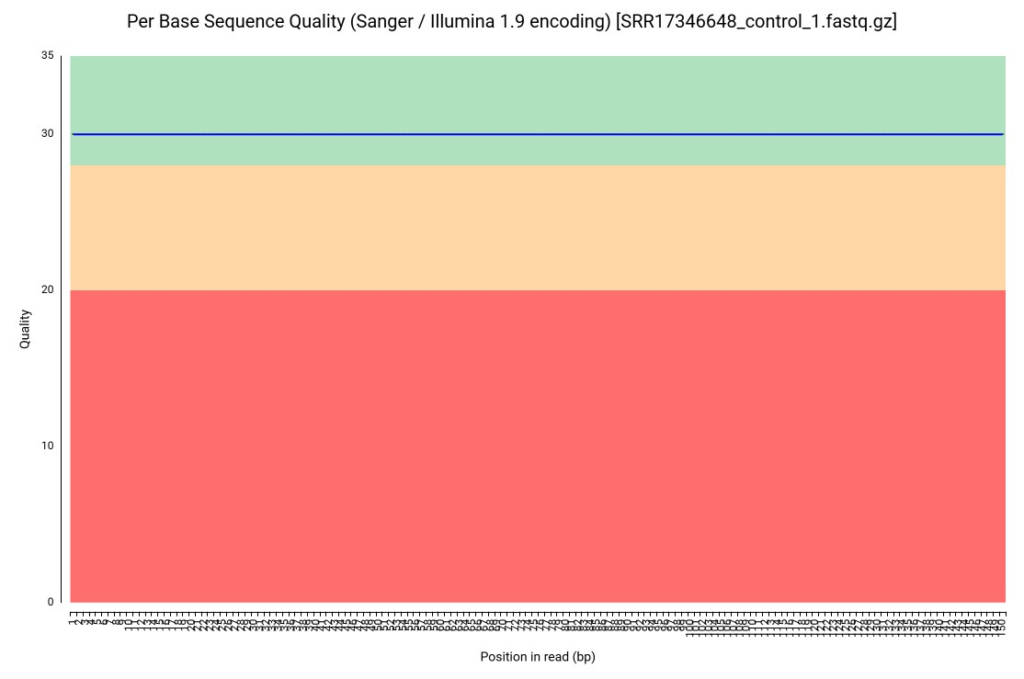
Figure 1. Per-base sequence quality profile for R. indica reads (sample SRR17346648).
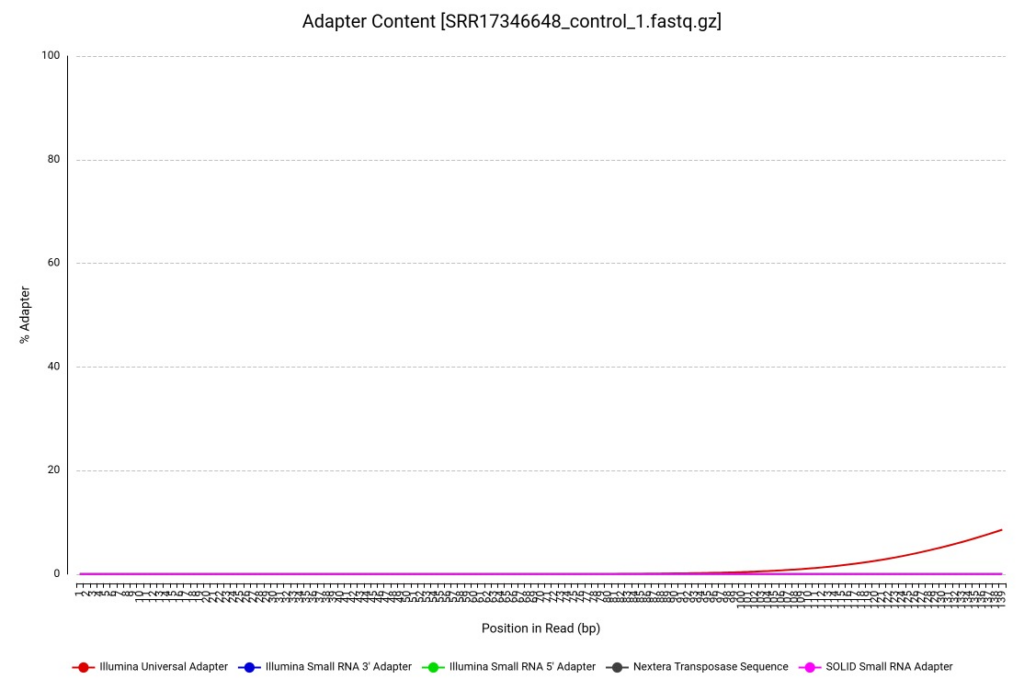
Figure 2. Adapter Content for R. indica reads (sample SRR17346648).
Trimming
Given that our initial quality check revealed an unusually “flat” and high-quality profile, suggesting prior processing by the authors, our focus with Trimmomatic shifted from general quality filtering to targeted adapter removal and safety pruning.
Since the sequencing was performed using the Illumina HiSeq 2000 platform, we configured the trimming wizard to specifically target TruSeq3 adapters.
The effectiveness of this targeted pruning is clearly demonstrated in the post-processing results. As shown in the Adapter Content plot (Figure 3), the residual Illumina adapters identified during the initial FastQC stage were successfully clipped.
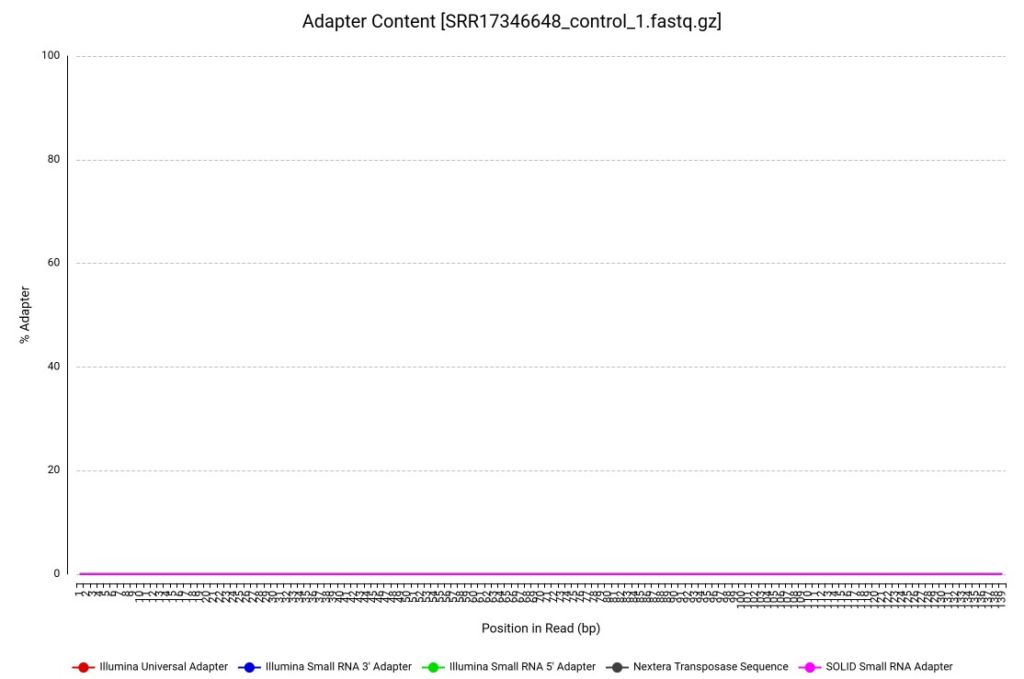
Figure 3. Adapter Content for R. indica reads after trimming (sample SRR17346648).
Contaminant Removal
As highlighted by Alvarez & Landsman (2024), the purity of the input data is the most critical factor for a successful assembly. Theoretically, assemblers expect data from a single organism; however, “off-target” RNA contamination is more common than expected and can lead to misleading biological conclusions.
Working with an infested plant means the library is a mixture of R. indica and the mustard aphid (L. erysimi). Furthermore, human-derived sequences (H. sapiens) can be amplified during PCR, potentially contaminating the final library. In OmicsBox, we utilized the Contaminant Removal tool to remove reads not belonging to R. indica. Since a reference genome for the mustard aphid (L. erysimi) was unavailable, we employed a proxy-species strategy using the genome of the cabbage aphid, Brevicoryne brassicae.
Figures 4 and 5 show the relative alignment distribution against the human and aphid genomes, respectively. In these charts, green represents reads that aligned to the contaminant reference, while red represents unmapped reads. In this specific analysis, having almost entirely red bars is a positive signal. It demonstrates that our samples contained minimal levels of human and aphid genetic material. To ensure the highest accuracy, we discarded the few reads that matched the contaminants (green) and continued the workflow exclusively with the non-aligned reads (red). By filtering our reads against the genomes of H. sapiens and B. brassicae, we ensured that the Trinity pipeline only processed plant-specific mRNA, which should prevent the formation of assembled chimeric transcripts.
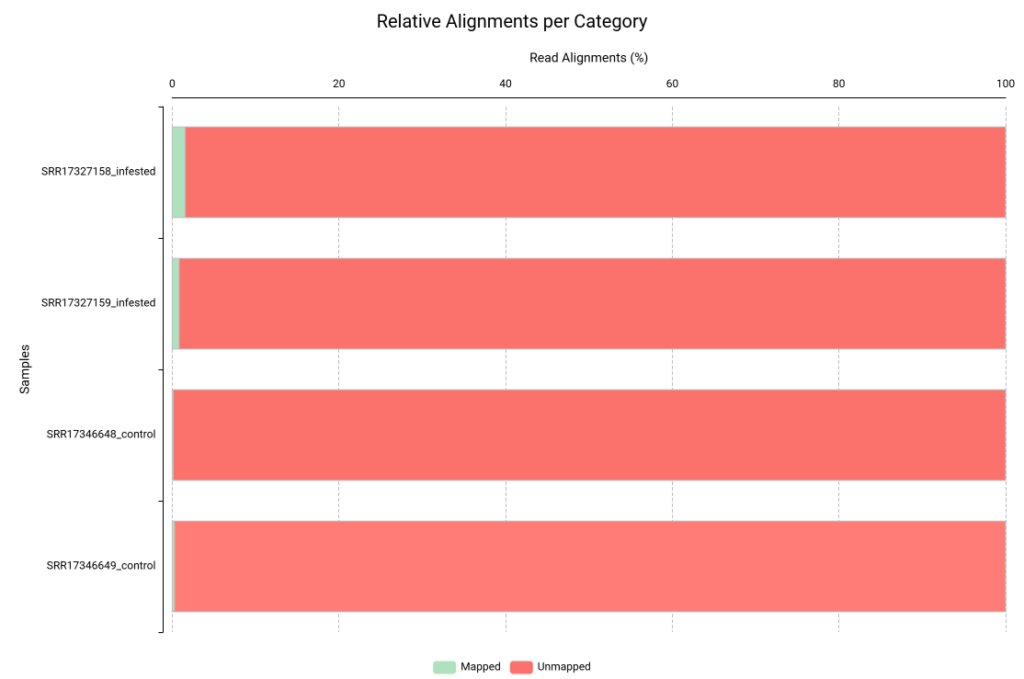
Figure 4. Read alignment distribution against H. sapiens genome.
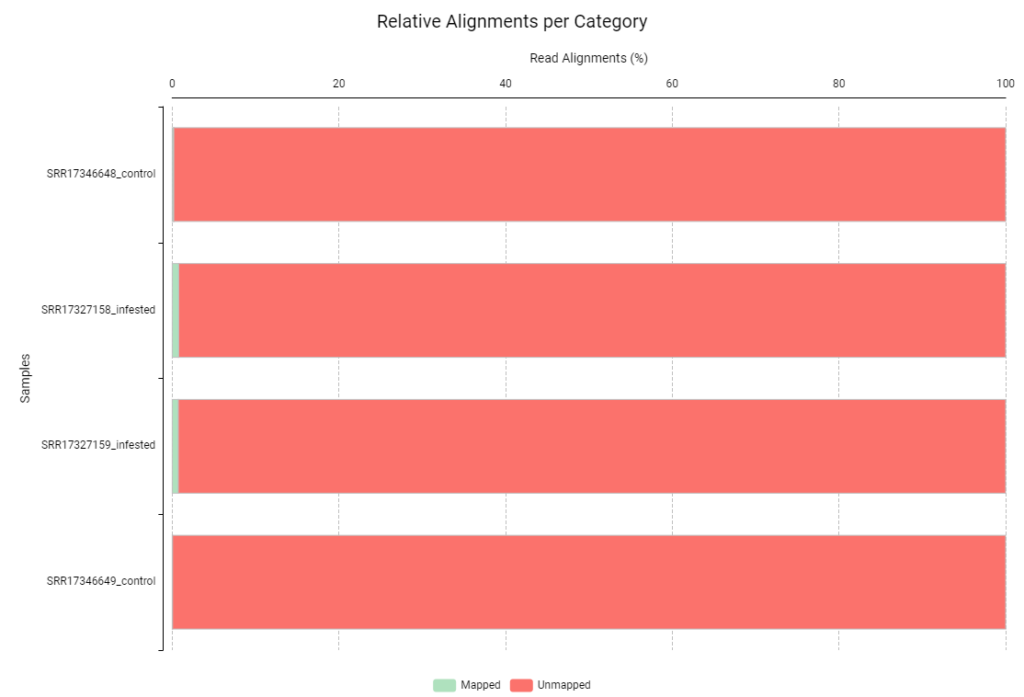
Figure 5. Read alignment distribution against B. brassicae genome.
rRNA removal
Ribosomal RNA (rRNA) is the most abundant RNA type in any cell, often comprising up to 90% of the total RNA pool. In the study by Kopylova et al. (2012), the authors emphasize that while experimental mRNA enrichment kits (like poly-A selection) are widely used, they are frequently “not fully satisfactory.” Residual rRNA fragments often contaminate the sequencing libraries, leading to a significant waste of computational resources during assembly.
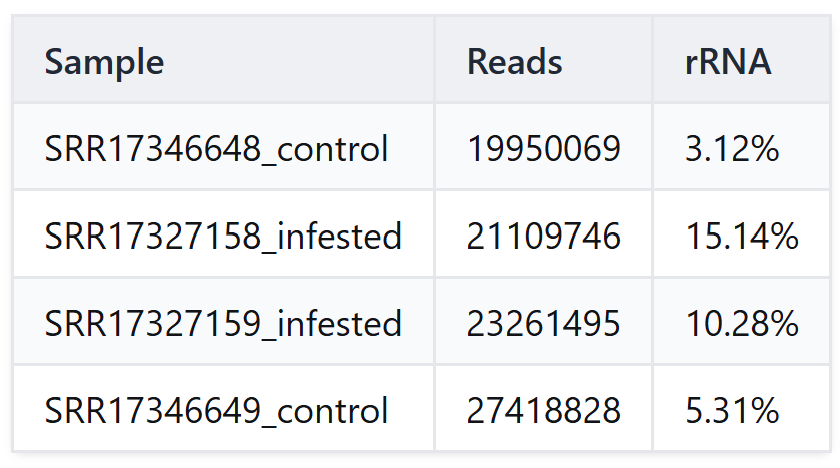
For our Rorippa indica analysis, we integrated SortMeRNA into our pipeline, which remains one of the most efficient algorithms for this task. Our results (Table 1) revealed residual rRNA levels ranging from 3.12% to 15.14%. Notably, the infested samples showed a higher percentage of ribosomal contamination compared to the controls. This finding underscores the necessity of bioinformatic depletion; by removing these millions of non-coding reads, we reduced the computational complexity and potential noise for the subsequent de novo assembly.
Table 1. Alignment statistics of residual ribosomal RNA (rRNA) using SortMeRNA.
Phase 2: De Novo Assembly & Transcriptome Refinement
RNA-Seq Assembly with Trinity
For the assembly, we employed Trinity, the gold standard for de novo transcriptomics. Trinity reconstructs transcripts by grouping reads into clusters and then resolving the underlying isoforms using de Bruijn graphs.
For our assembly, the library type was configured as Non-Strand Specific. This decision was based on the library preparation method used (NEBNext Ultra II RNA Library Prep Kit).
Upon completion, Trinity generated two primary outputs:
- A FASTA file containing the sequences of all assembled transcripts.
- A Transcript-to-Gene mapping file, which could be used for downstream quantification, as it links multiple transcripts to their respective genes.
The assembly yielded a total of 56,434 transcripts grouped into 21,708 genes.
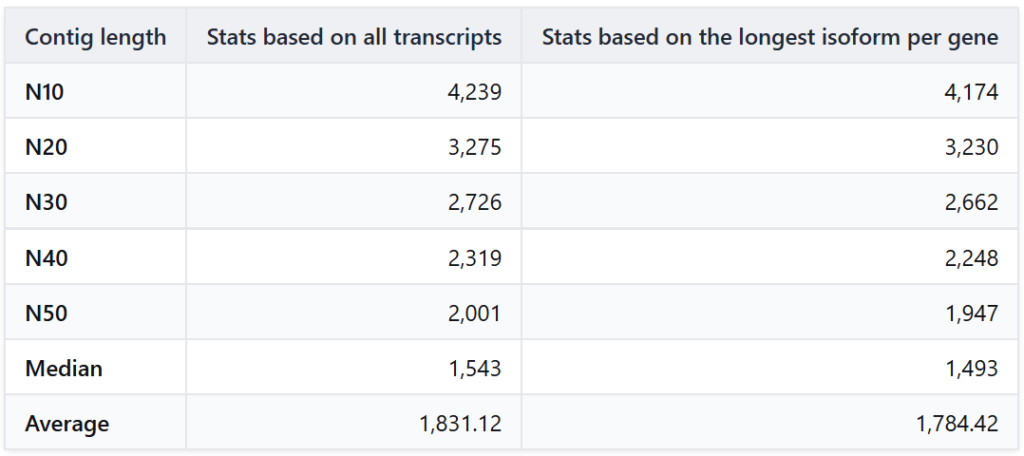
To evaluate the success of our assembly, we analyzed the length distribution statistics (Table 2). The N50 value is the most widely used metric for assembly contiguity: it represents the length such that at least 50% of the total assembled bases are contained in contigs of this size or longer.
An N50 of 2,001 bp for the total transcriptome is an excellent result for a de novo plant assembly. It indicates that the assembly is highly contiguous, with at least half of the sequence information contained in transcripts longer than 2kb.
Table 2. Length distribution and contiguity statistics for the de novo transcriptome assembly.
Sequence Clustering with CD-HIT
To refine the transcriptome, we applied CD-HIT with a 95% identity threshold. This step is crucial for “collapsing” redundant isoforms and fragments into a set of representative unigenes.
We reduced the dataset from 56k transcripts to 39,156 high-quality isoforms. This ensures that our downstream statistical analysis isn’t diluted by redundant sequences.
Completeness assessment with Busco
To evaluate the quality of our assembly, we performed a completeness assessment using BUSCO (Benchmarking Universal Single-Copy Orthologs) against the Viridiplantae database. BUSCO evaluates transcriptome quality by searching for a set of evolutionarily conserved genes that are expected to be present in a single copy across a specific taxonomic group.
The results were outstanding: we achieved a 96% completeness score. It is important to note that a significant portion of these genes were reported as “duplicated.” While this might be a concern in genome assembly, it is common and expected in de novo transcriptomes. Since assemblers like Trinity reconstruct multiple isoforms for the same locus, BUSCO correctly identifies these various versions of the same conserved gene as duplicates. This high overall score confirms that our isoforms capture nearly the entire essential gene space of the plant.
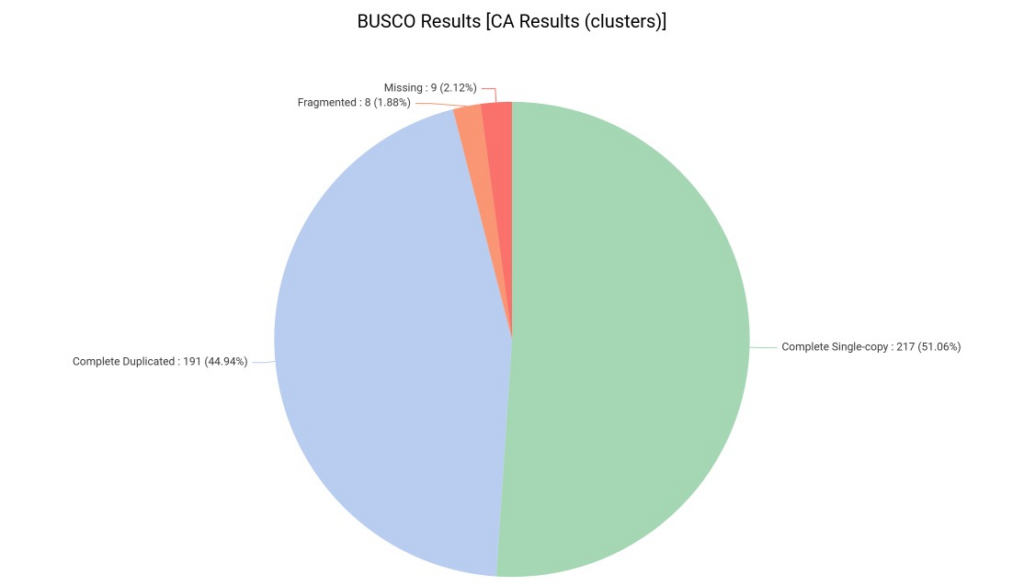
Figure 6. BUSCO completeness assessment showing 96% coverage of essential orthologs against the Viridiplantae database.
Phase 3: Differential Expression Analysis
Transcript-level Quantification
Once the de novo transcriptome was assembled and refined, the next critical step was to estimate the abundance of each transcript across our samples. For this, we employed RSEM (RNA-Seq by Expectation-Maximization). Unlike simple counting methods, RSEM is specifically designed to handle the complexities of de novo assemblies.
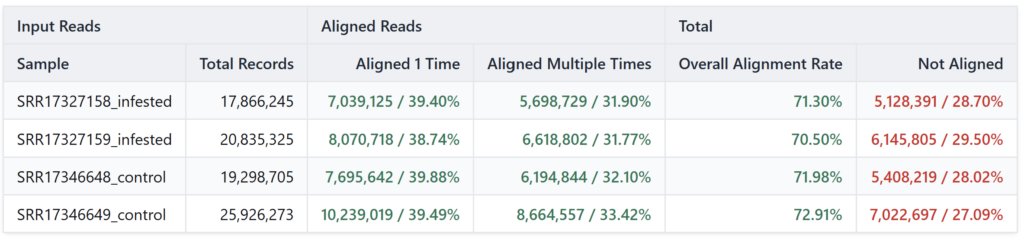
The quantification results (shown in Table 3) provide a robust validation of our assembly. We achieved a highly consistent overall alignment rate across all samples, ranging from 70.50% to 72.91%.
A detailed look at the alignment breakdown reveals that approximately 39% of the reads mapped uniquely (“Aligned 1 Time”), while roughly 32% mapped to multiple isoforms (“Aligned Multiple Times”). This significant proportion of multi-mapping reads is expected, as it reflects the high level of transcript diversity and alternative splicing captured in our assembly. By performing quantification at the isoform level rather than the gene level, we ensured that our analysis captures the full granularity of the Rorippa indica response.
Table 3. Read distribution for the R. indica transcriptome quantification using RSEM.
Moreover, before proceeding to differential expression, we visualized the global structure of our data using a Principal Component Analysis (PCA).
The first principal component (PC1) accounts for half of the total variance in the dataset. As shown in Figure 7, PC1 perfectly separates the Infested samples (blue) from the Control samples (red).
However, the second principal component (PC2) accounts for 29% of the variance and appears to separate the samples by replicate rather than by condition.
It suggests that Replicate 1 of both groups might have been processed, sequenced, or handled differently than Replicate 2 (batch effect). However, after a thorough review of the original study’s metadata, there is no explicit information regarding the library preparation. If this experimental information were available, it could be corrected during the differential expression analysis by incorporating this unwanted variation into the statistical model, specifically by setting the “batch” factor as a “blocking factor”.
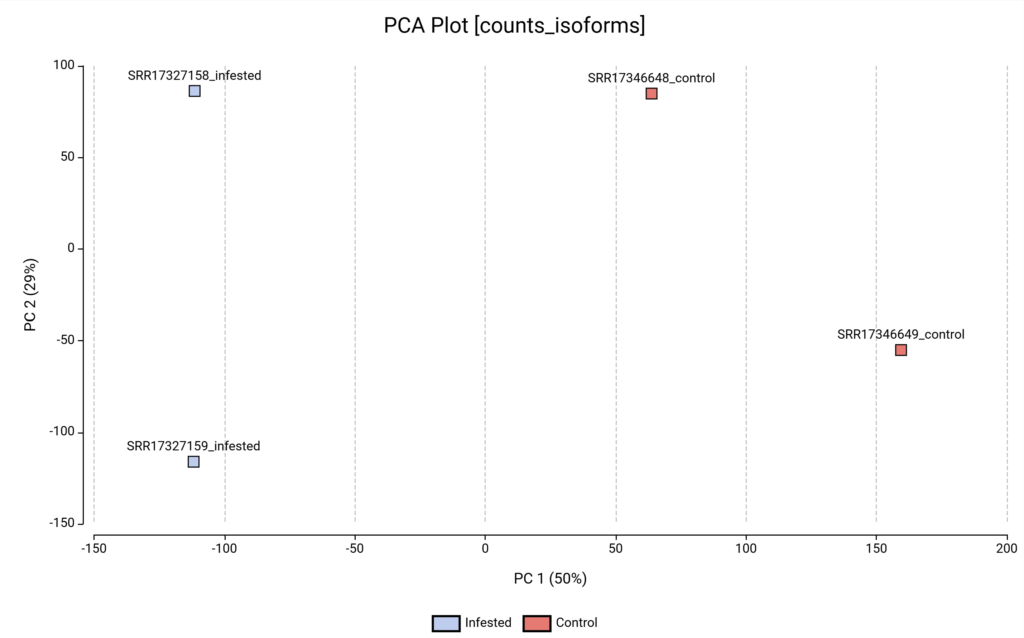
Figure 7. PCA plot based on transcript-level quantification.
EdgeR
To identify the specific genes driving the resistance in Rorippa indica, we performed a Pairwise Differential Expression Analysis using the edgeR package, which has been developed to enable analysis of experiments with small numbers of replicates (like our case).
Before running the statistical tests, we performed a crucial “data cleaning” step within the Preprocessing Data Page. To ensure our results were not skewed by “genomic noise” or lowly expressed transcripts that could interfere with the statistical model, we applied a Counts Per Million (CPM) filter of at least 2 samples being above 1 CPM. Transcripts not meeting this criterion are excluded from the analysis.
Regarding the experimental design, the Control (uninfested) plants served as our “baseline” or “healthy” state (reference condition), and the Infested plants were established as the contrast condition.
To ensure we only captured the most robust biological responses, we applied a False Discovery Rate (FDR) < 0.05 and a |log2FC| ≥ 2. After applying these filters, the edgeR analysis identified a total of 691 Differentially Expressed Genes (DEGs; 488 upregulated and 203 downregulated).
To provide a visual summary of the DEGs, we generated two of the most informative plots in transcriptomics: the Volcano Plot and the Hierarchical Clustering Heatmap.
The Volcano Plot (Figure 8) highlights the high-confidence DEGs. Upregulated genes are colored in red, and downregulated genes are green colored. The wide horizontal spread (LogFC) and high vertical significance (-logFDR) show that many genes are not just changing, but “exploding” in expression, marking a massive defensive shift.
The heatmap (Figure 9) provides a clear “molecular signature” of the infestation. Most importantly, the top dendrogram shows perfect sample clustering, where replicates group strictly by condition. This visual “red vs. green” switch across the two gene blocks confirms the biological impact of the aphid.
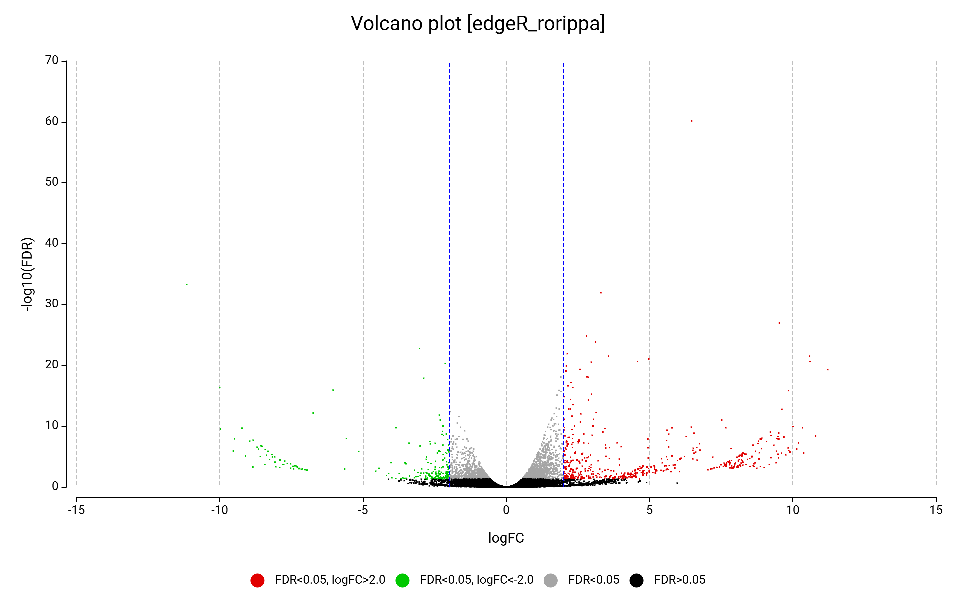
Figure 8. Volcano plot of the differentially expressed genes obtained by edgeR, highlighting upregulated (red) and downregulated (green).
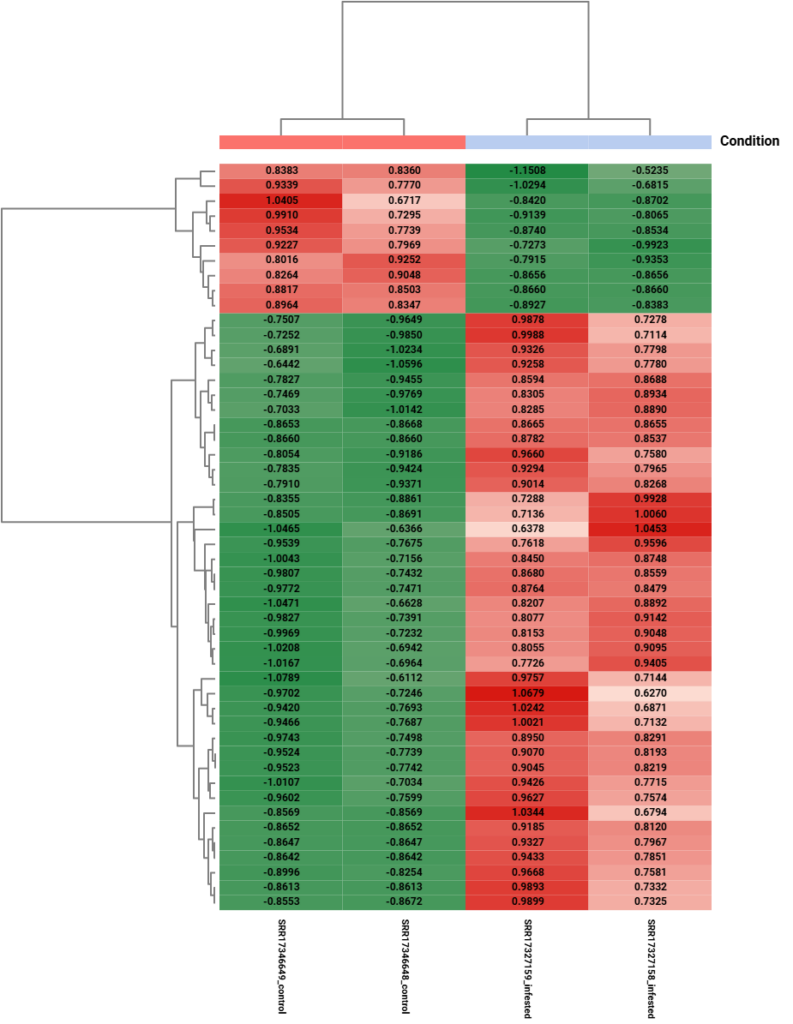
Figure 9. Hierarchical clustering heatmap of differentially expressed genes obtained by edgeR.
DESeq2
To complement and validate our edgeR results, we performed a secondary differential expression analysis using the DESeq2 implementation (also developed to enable analysis of experiments with small numbers of replicates), which is known to be relatively conservative (Seyednasrollah et al., 2015).
Using the same thresholds (|log2FC| ≥ 2 and FDR < 0.05), the DESeq2 pipeline identified 546 Differentially Expressed Genes (DEGs), consisting of 400 upregulated and 146 downregulated transcripts. Although the total number of DEGs is slightly lower than in the edgeR analysis (691 vs. 546), the overall biological trend remains highly consistent. Moreover, the Hierarchical Clustering Heatmap (Figure 11) clearly reproduces the distinct separation between infested and control plants.
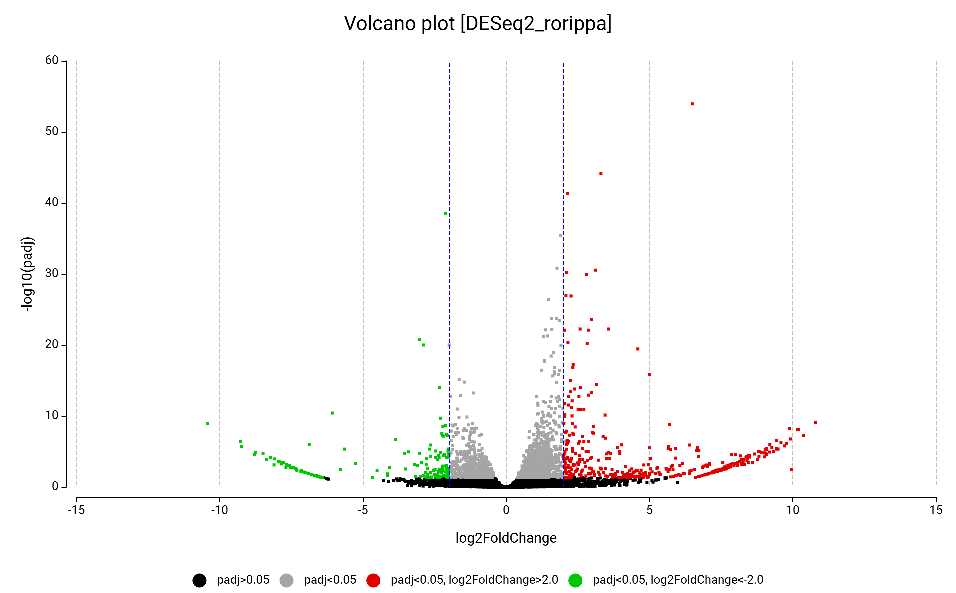
Figure 10. Volcano plot of the differentially expressed genes obtained by DESeq2, highlighting upregulated (red) and downregulated (green).
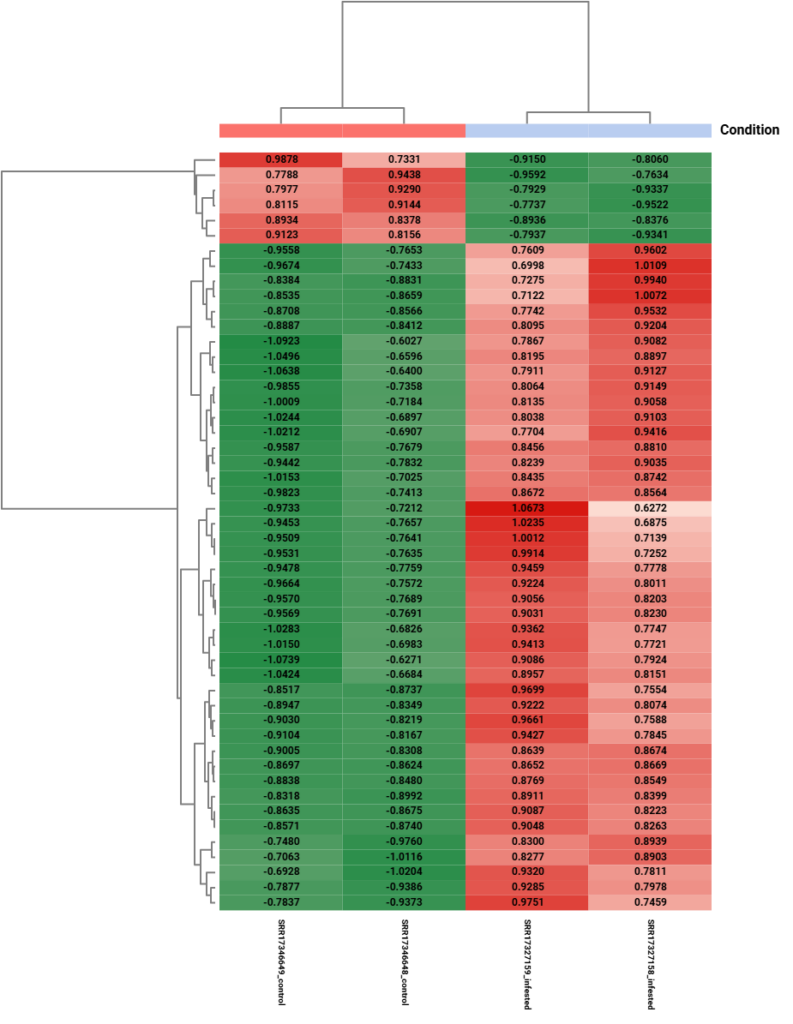
Figure 11. Hierarchical clustering heatmap of differentially expressed genes obtained by DESeq2.
Venn Diagram
To determine the reliability of our differential expression results, we performed an intersection analysis using the OmicsBox Venn Diagram tool. This allowed us to visualize the overlap between the genes identified by edgeR and DESeq2.
The comparison of upregulated genes (Figure 12) reveals a massive agreement between both packages: 391 out of the 400 genes identified by DESeq2 (97.7%) were also present in the edgeR list. The results for the downregulated genes (Figure 13) are even more compelling, showing a near-perfect overlap where 145 out of 146 genes from DESeq2 were shared.
While the broader list of unique DEGs obtained by edgeR reflects its higher sensitivity, this level of convergence across distinct statistical models confirms that our findings represent a robust biological signal rather than methodological noise.
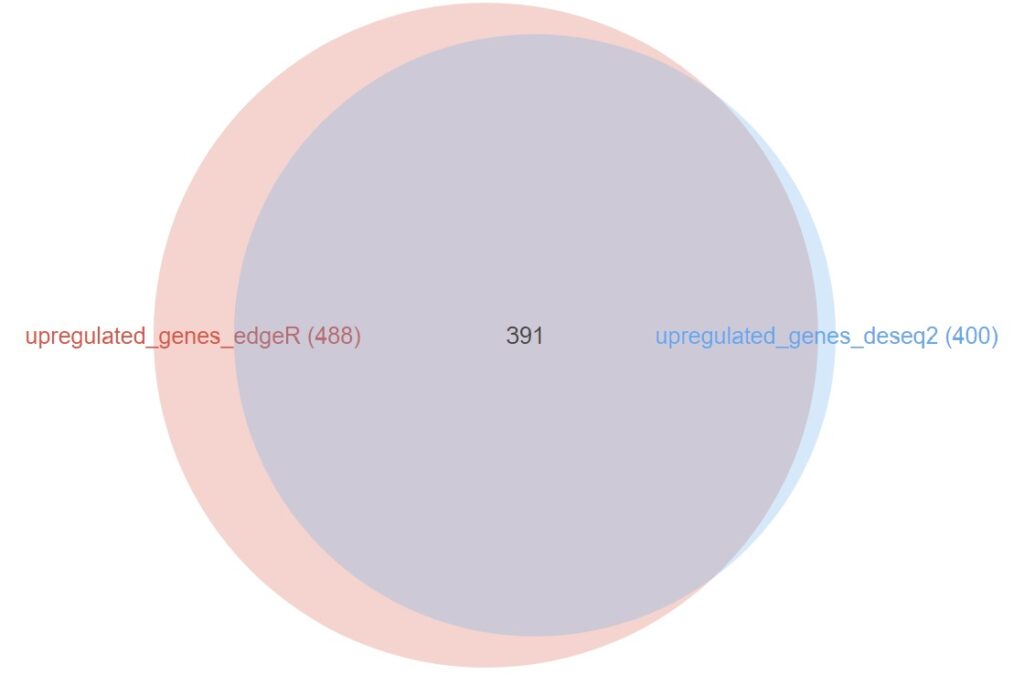
Figure 12. Venn Diagram showing the overlap between upregulated genes identified by edgeR and DESeq2.
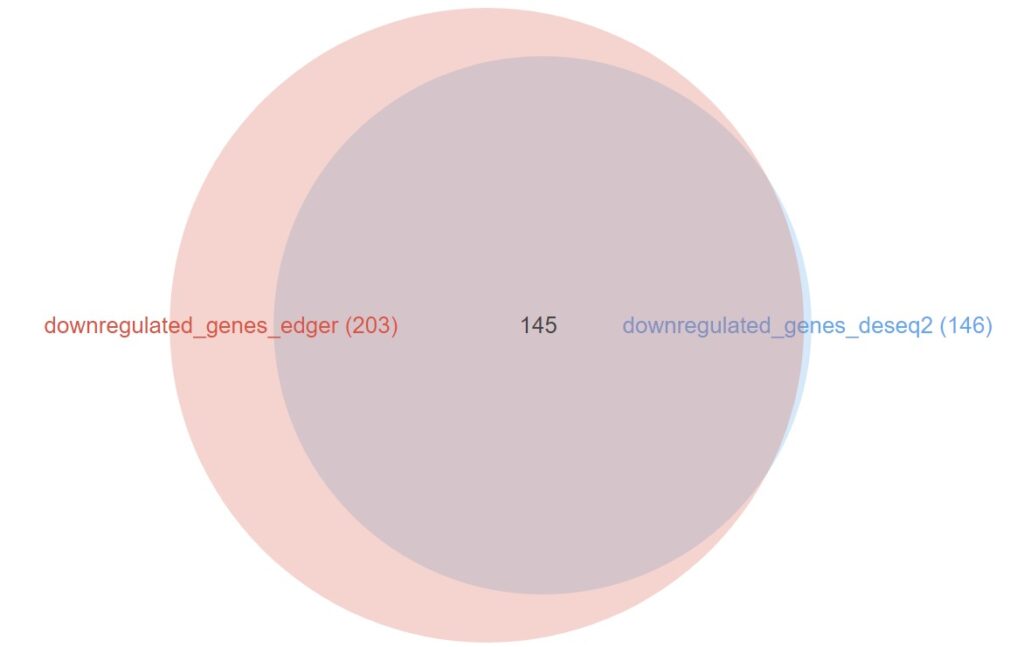
Figure 13. Venn Diagram showing the overlap between downregulated genes identified by edgeR and DESeq2.
Phase 4: Functional Analysis
Functional Annotation
The most critical step for any de novo project is transforming raw transcript IDs into meaningful biological labels. For Rorippa indica, we followed the Blast2GO methodology implemented in OmicsBox. This structured approach begins with high-sensitivity sequence similarity searches, followed by a robust GO mapping and annotation pipeline to ensure the highest biological accuracy.
We initiated the process using Diamond BLASTx against the NCBI non-redundant (nr) protein database. This high-performance aligner allowed us to perform a translated search of our transcripts against the full protein space with high sensitivity. To ensure the highest accuracy, biological relevance, and computational efficiency, we applied a taxonomic filter, specifically targeting Viridiplantae.
The resulting distribution (Figure 14) serves as a powerful validation of our assembly’s biological integrity.
- The Dominant Hit: Over 20,000 sequences showed their primary hit in Cardamine amara subsp. amara. This result is perfectly expected; both Rorippa and Cardamine belong to the Cardamineae tribe within the Brassicaceae family.
- Secondary Hits: The subsequent hits were dominated by other crucifers like Arabidopsis thaliana and Arabidopsis suecica. The fact that our transcripts match closely related species confirms that our Trinity assembly accurately reconstructed the plant’s protein-coding genes.
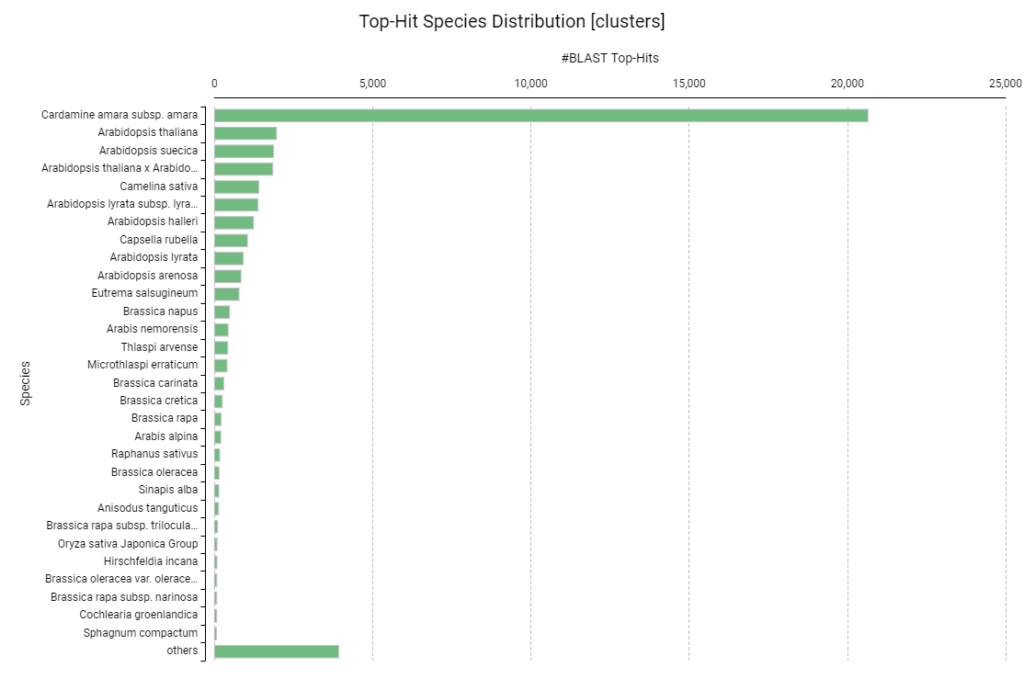
Figure 14. Distribution of top-hit species from BLASTx analysis against Viridiplantae.
To transform sequence similarity into specific biological roles, we completed the Blast2GO process by:
- GO Mapping: We retrieved all Gene Ontology (GO) terms associated with our BLAST hits.
- GO Annotation: We applied an annotation rule to select the most reliable GO terms for each transcript based on similarity and evidence codes.
Finally, to achieve a “gold-standard” annotation, we integrated our BLAST-based results with two orthogonal sources:
- InterProScan: To identify functional domains and motifs.
- eggNOG: To identify evolutionary orthologs across multiple species.
By merging these three sources (Blast2GO + EggNOG + InterPro), we implemented a Consensus Annotation Strategy. This allowed us to minimize individual tool biases and “rescue” functional information for transcripts that lacked clear sequence similarity but contained conserved protein domains.
Enrichment Analysis
To ensure our conclusions were not biased by a single algorithm, we implemented a dual functional enrichment strategy using the outputs from both edgeR and DESeq2.
To gain a multi-angled view of the host-pest interaction, we performed two complementary analyses:
- Fisher’s Exact Test: To identify over-represented terms within discrete lists of differentially expressed genes (DEGs).
- Gene Set Enrichment Analysis (GSEA): To detect subtle, coordinated shifts across the entire transcriptome.
Both analyses utilized our custom Functional Annotation as the reference background to ensure maximum biological context. Moreover, we also applied a GO Redundancy Reduction step following both tests using the sidebar option in OmicsBox. By collapsing redundant or overly generic parental terms into their most informative child nodes, we refined our results into a high-resolution map of the specific biological events defining the Rorippa-aphid interaction.
EdgeR Perspective
Fisher’s Exact Test
This test identifies GO terms over-represented in our specific list of 691 DEGs compared to the rest of the transcriptome. We analyzed upregulated and downregulated genes separately:
- Upregulated Genes: Our results showed a significant over-representation of Oxidoreductase activity and Linoleate 13S-lipoxygenase (13-LOX) activity. The latter is a critical biological indicator; 13-LOX serves as the rate-limiting enzyme in the Jasmonic Acid (JA) biosynthesis pathway, the primary hormonal mediator of plant immunity against piercing-sucking insects like aphids (Browse, 2009). Additionally, the enrichment in chitin binding confirms that the plant is actively recognizing the aphid’s structural components, likely triggering Pattern-Triggered Immunity (PTI) (Miya et al., 2007). The high significance of oxidoreductase activity further points to a tightly regulated redox state to manage the oxidative stress caused by aphid feeding.
- Downregulated Genes: Conversely, suppressed genes were almost exclusively associated with the cytoskeleton and cell cycle progression. Terms such as microtubule-based movement, kinesin complex, and mitotic spindle assembly dominated the results. This suggests that the plant is systematically halting its growth machinery to conserve metabolic resources for defense.
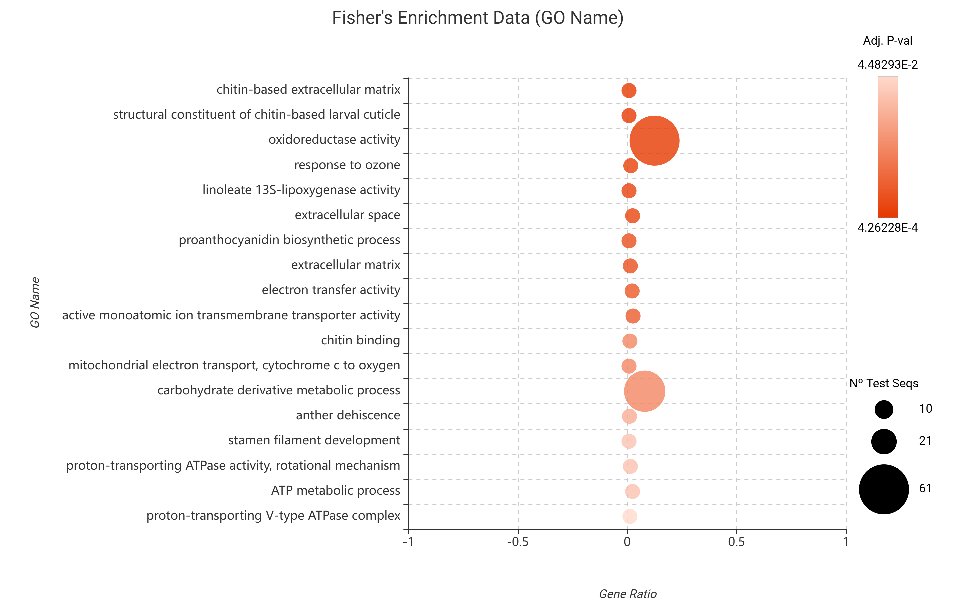
Figure 15. Fisher’s Exact Test results for upregulated genes (edgeR).
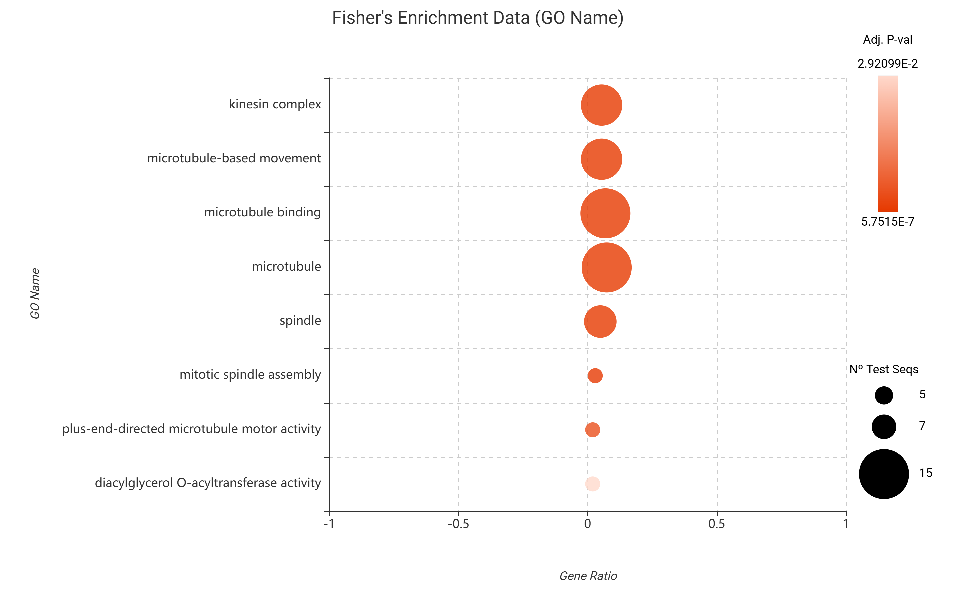
Figure 16. Fisher’s Exact Test results for downregulated genes (edgeR).
Gene Set Enrichment Analysis
Unlike Fisher’s test, which focuses on significant DEGs, GSEA analyzes the entire ranked list of 39,156 isoforms. This allows us to detect subtle, coordinated shifts in entire functional pathways.
The most significant positive signal was the “Response to chitin.” This validates that even genes with modest fold-changes are operating in concert to amplify the plant’s sensitivity to the aphid’s physical presence, reinforcing the early-stage immune response.
Conversely, the GSEA results provided a high-resolution map of the “metabolic sacrifice.” Significant negative enrichment scores (NES) were observed for DNA integration, DNA replication initiation, and microtubule binding. This massive, coordinated downregulation of cell division infrastructure confirms that R. indica prioritizes survival over development during biotic stress to optimize fitness (Lozano-Durán & Zipfel, 2015).
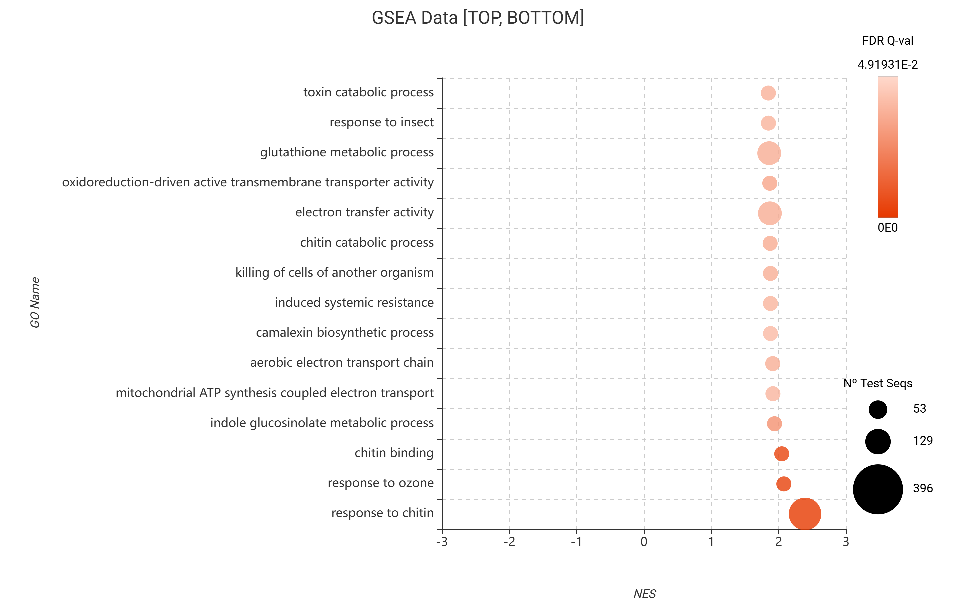
Figure 17. GSEA bubble plot for Gene Ontology terms, filtered to show the 15 most enriched categories (top NES) based on edgeR differential expression.
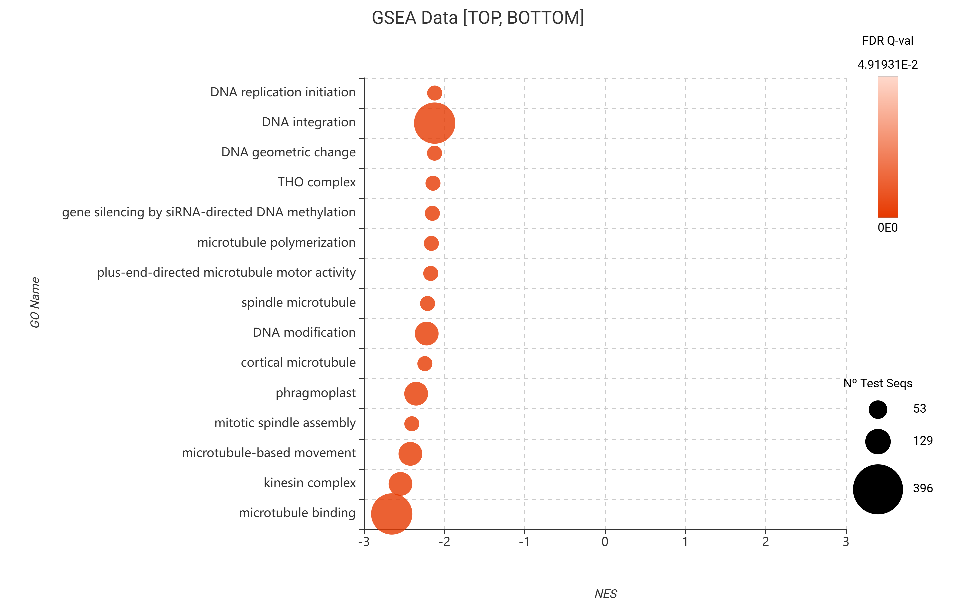
Figure 18. GSEA bubble plot for Gene Ontology terms, filtered to show the 15 most depleted categories (bottom NES) based on edgeR differential expression.
DESeq2 Perspective
Fisher’s Exact Test
Using the more conservative set of 546 DEGs identified by DESeq2, the enrichment results (Figures 19 and 20) highlighted a precise and robust defensive signature.
- Upregulated Genes: Consistent with the edgeR analysis, Chitin-based extracellular matrix and 13-LOX activity emerged as top enriched terms. This cross-method validation confirms that, even under a stricter statistical model, the JA pathway and chitin perception remain the undisputed pillars of the plant’s immune response.
- Downregulated Genes: The suppression signals were strikingly clear. Enrichment in terms related to the kinesin complex, mitotic spindle assembly, and microtubule binding was highly significant. This reinforces the hypothesis that the decision to “switch off” structural and division machinery is not a statistical artifact, but a core, high-confidence biological event in the plant’s survival strategy.
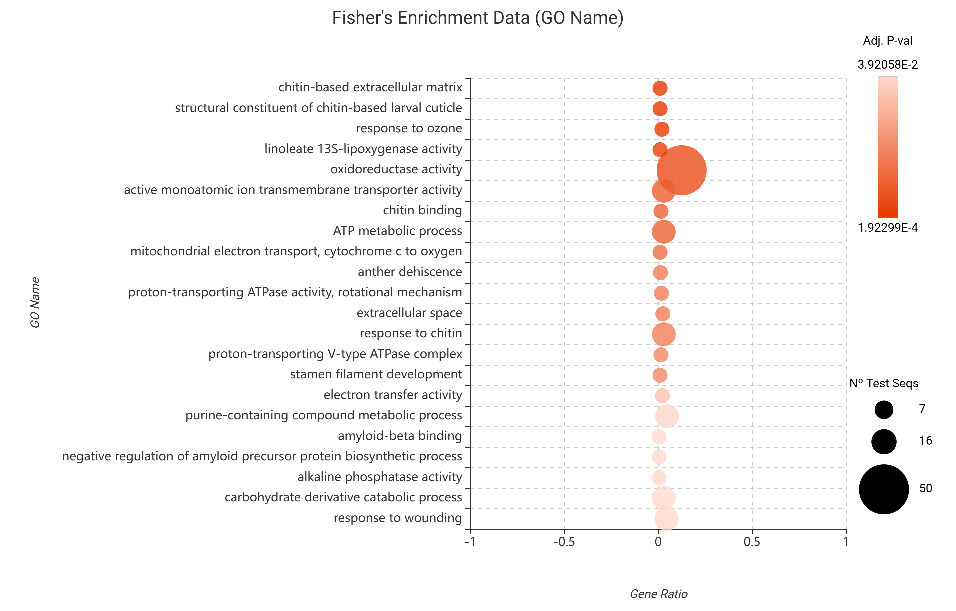
Figure 19. Fisher’s Exact Test results for upregulated genes (DESeq2).
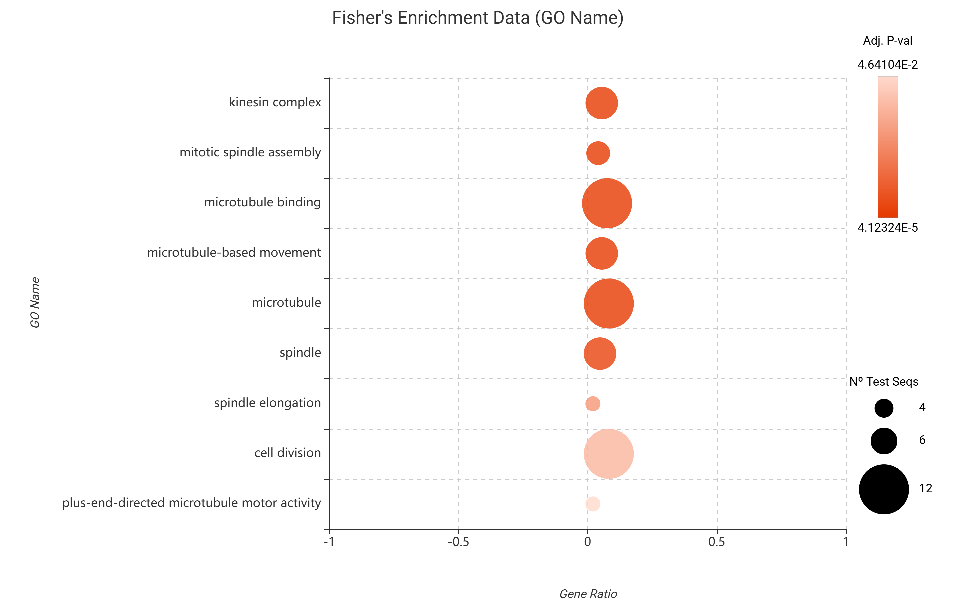
Figure 20. Fisher’s Exact Test results for downregulated genes (DESeq2).
Gene Set Enrichment Analysis
The GSEA of the DESeq2-ranked list (Figures 21 and 22) served as a critical validation step, yielding a functional landscape that nearly mirrors the results obtained with edgeR. This cross-method consistency strengthens the reliability of our findings.
Beyond the primary response to chitin, both analyses consistently highlighted the activation of specialized defense pathways. Specifically, the enrichment of indole glucosinolate metabolic processes confirms a robust chemical defense, as these tryptophan-derived compounds are known to be essential JA-regulated barriers against a wide range of sucking herbivores (Widemann et al., 2021). A fascinating finding in Figure 21 is the enrichment of the term “disruption of anatomical structure in another organism.” This likely reflects the plant’s active attempt to interfere with the aphid’s physiology.
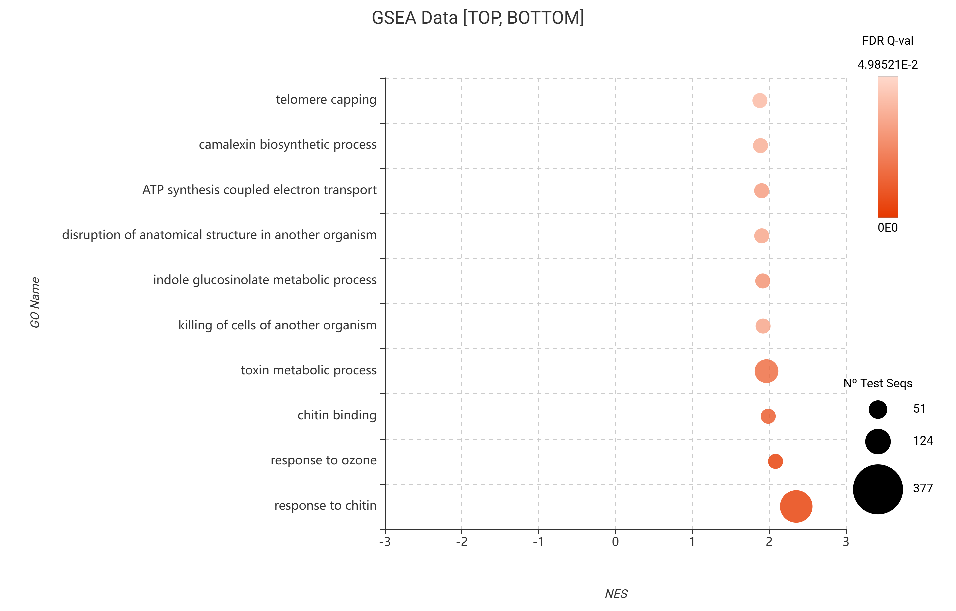
Figure 21. GSEA bubble plot for Gene Ontology terms, filtered to show the 10 most enriched categories (top NES) based on DESeq2 differential expression.
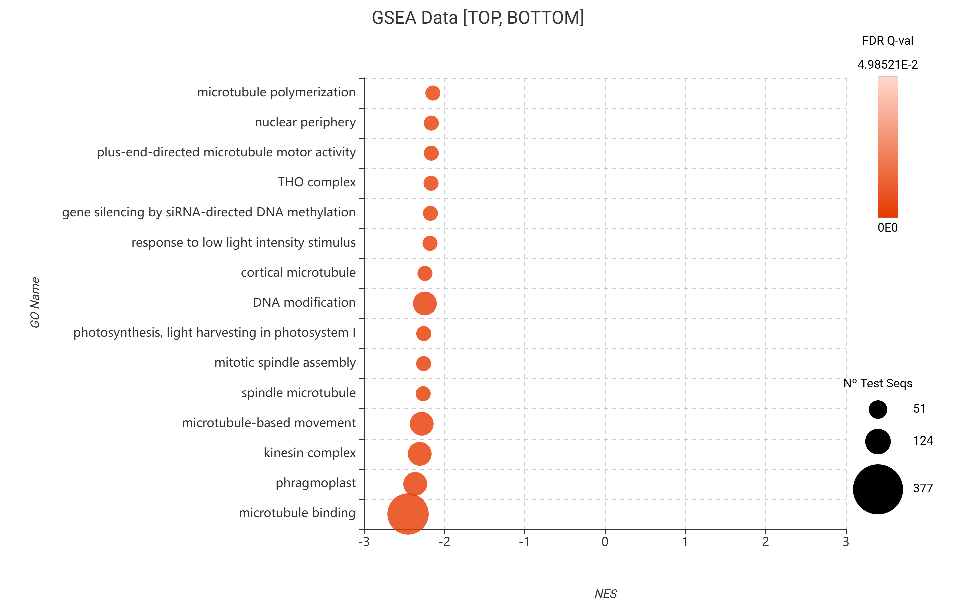
Figure 22. GSEA bubble plot for Gene Ontology terms, filtered to show the 15 most depleted categories (bottom NES) based on DESeq2 differential expression.
The consistency of these results across both GSEA and Fisher’s Test—and across both edgeR and DESeq2—solidifies our “Growth-Defense Tradeoff” hypothesis. The plant isn’t just slowing down; it is systematically dismantling the infrastructure required for DNA modification and cortical microtubule organization to prioritize survival.
Pathway Analysis
The final layer of our biological interpretation is Pathway Analysis. As highlighted in the OmicsBox methodology, this tool allows us to move beyond lists of individual genes to visualize the topology of biological reactions. By integrating our edgeR differential expression data into these interaction networks, we pinpointed exactly which “circuits” in Rorippa indica are being rewired during the aphid attack.
For this study, we utilized a Combined Pathway Analysis integrating two major databases:
- Plant Reactome: We explicitly disabled the standard Reactome database because it is primarily curated for human biology. Instead, we enabled Plant Reactome (Gramene), which contains inferred orthologous reactions specific to the plant kingdom. Within this module, we established “Give Priority to Taxon” for Arabidopsis thaliana, ensuring that our sequences were linked to the most phylogenetically relevant model organism available.
- KEGG (Kyoto Encyclopedia of Genes and Genomes): We enabled the KEGG database, linking sequences via eggNOG orthologs with a taxonomic scope narrowed to Viridiplantae. This ensures that the metabolic maps represent green plant metabolism, excluding irrelevant animal or bacterial pathways.
Our global distribution of found and enriched pathways (Figure 23) shows that “Metabolism and Regulation” is the most heavily impacted category, followed by “Growth and Developmental Processes.” This distribution quantifies our earlier observations: the plant is shifting its entire metabolic priority.
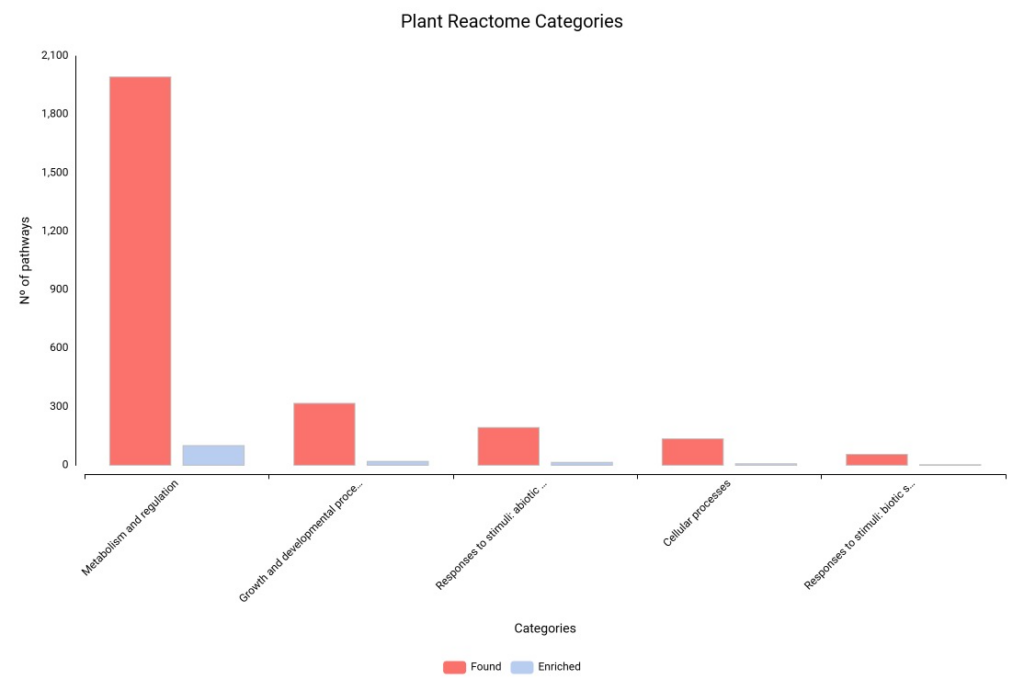
Figure 23. Distribution of enriched pathways across Plant Reactome categories.
The GSEA results provided a ranked overview of the most significant functional shifts. In the GSEA Bubble Plot (Figure 24), we identified the top 15 pathways sorted in descending order by their Normalized Enrichment Score (NES).
We observe a strong positive enrichment in Jasmonic acid biosynthesis (R-ATH-1119332) and Jasmonic acid signaling, further validating our earlier findings.
To visualize these changes at the enzymatic level, we generated the KEGG Pathway Diagram for Phenylpropanoid Biosynthesis (ko00940). This pathway is a basis of plant secondary metabolism, leading to the production of lignin and various phenolic defense compounds (Naoumkina et al., 2010).
As shown in Figure 25, the pathway is “painted” with our differential expression data, highlighting a dramatic response in the late stages of the route. A standout feature is the massive upregulation of Peroxidase (EC: 1.11.1.7). The associated expression heatmap clearly demonstrates that the sequences linked to this enzyme (such as TRINITY_DN732…) are highly upregulated (deep red) in the Infested condition.
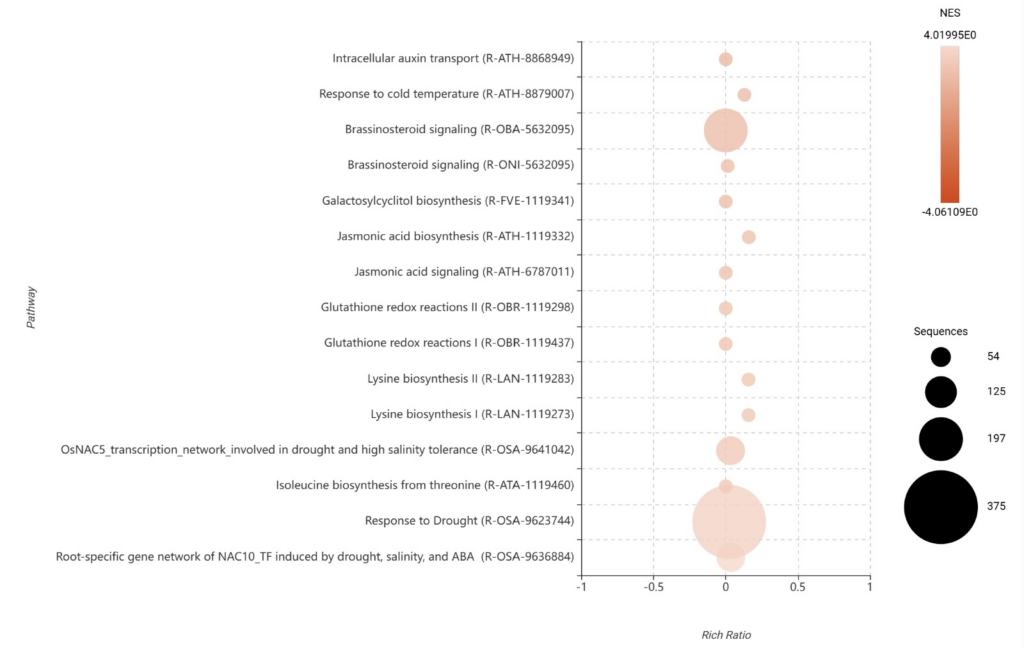
Figure 24. GSEA bubble plot identifying the top 15 functional pathways, filtered in descending order by their Normalized Enrichment Score (NES).
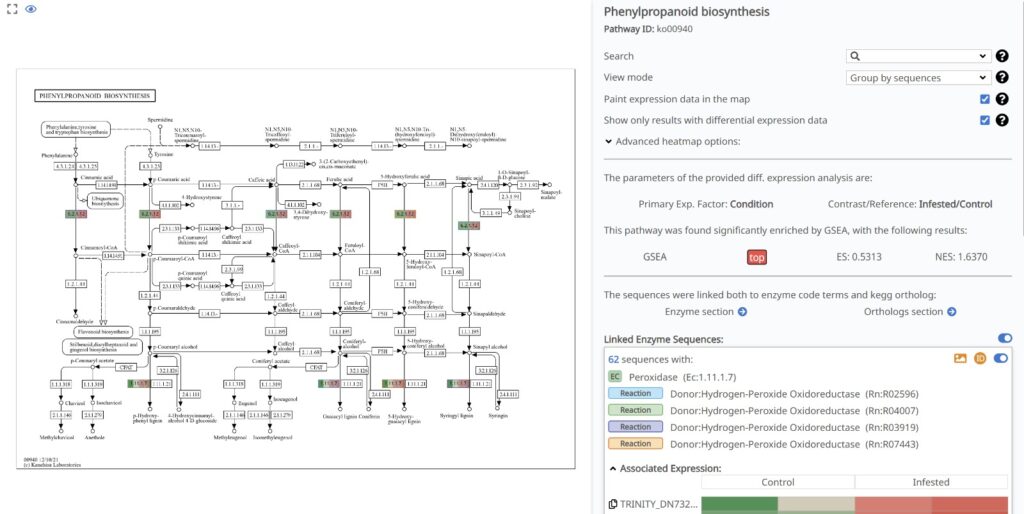
Figure 25. KEGG pathway diagram for Phenylpropanoid biosynthesis (ko00940) painted with expression data.
Conclusions
Our findings demonstrate a clear “Growth-Defense Tradeoff” (aligning with the core biological conclusions of the original study) where the plant recognizes the aphid through chitin perception, triggers a Jasmonic Acid-driven hormonal alarm, and redirects its energy from mitotic cell division (which we saw downregulated in GSEA) toward defensive mobilization.
This study not only highlights the resilience of Rorippa but also showcases how OmicsBox empowers researchers to navigate from raw de novo transcripts to a sophisticated understanding of plant-insect interactions.
CloudUnits Summary
OmicsBox utilizes OmicsCloud, an AWS-based high-performance computing (HPC) infrastructure, to execute resource-intensive bioinformatics tasks. These costs are measured in Cloud Units, which directly correspond to the compute infrastructure used, such as CPU seconds and data transfer volume. Most features within OmicsBox are included for free with an active subscription; only features related to Sequence Alignment and Assembly consume Cloud Units. Different tools need more or less computational resources, depending on the algorithm, input data, and used parameters.
The following table summarizes the resources consumed during this study. Please note that these are approximate values intended to serve as a reference:
| Tool | Input Size | Execution Time | Cloud Units Charged |
| Trinity de novo Assembly | ~8.5 GB (4 paired-end samples) | ~4 hours | ~250,000 |
| Diamond BLAST against Viridiplantae | ~40 MB (39,156 sequences) | ~1 hour | ~80,000 |
| InterProScan Domain & Motif Search | ~200 MB (39,156 sequences) | ~4 hours | ~100,000 |
References
- Alvarez, R. V., & Landsman, D. (2024). GTax: improving de novo transcriptome assembly by removing foreign RNA contamination. Genome Biology, 25(1), 12.
- Bandopadhyay, L., Basu, D., & Ranjan Sikdar, S. (2024). De novo transcriptome assembly and global analysis of differential gene expression of aphid tolerant wild mustard Rorippa indica (L.) Hiern infested by mustard aphid Lipaphis Erysimi (L.) Kaltenbach. Functional & Integrative Genomics, 24(2), 43.
- Browse, J. (2009). The power of mutants for investigating jasmonate biosynthesis and signaling. Phytochemistry, 70(13-14), 1539-1546.
- Kopylova, E., Noé, L., & Touzet, H. (2012). SortMeRNA: fast and accurate filtering of ribosomal RNAs in metatranscriptomic data. Bioinformatics, 28(24), 3211-3217.
- Lozano-Durán, R., & Zipfel, C. (2015). Trade-off between growth and immunity: role of brassinosteroids. Trends in plant science, 20(1), 12-19.
- Miya, A., Albert, P., Shinya, T., Desaki, Y., Ichimura, K., Shirasu, K., … & Shibuya, N. (2007). CERK1, a LysM receptor kinase, is essential for chitin elicitor signaling in Arabidopsis. Proceedings of the National Academy of Sciences, 104(49), 19613-19618.
- Naoumkina, M. A., Zhao, Q., Gallego‐Giraldo, L. I. N. A., Dai, X., Zhao, P. X., & Dixon, R. A. (2010). Genome‐wide analysis of phenylpropanoid defence pathways. Molecular plant pathology, 11(6), 829-846.
- Seyednasrollah, F., Laiho, A., & Elo, L. L. (2015). Comparison of software packages for detecting differential expression in RNA-seq studies. Briefings in bioinformatics, 16(1), 59-70.
- Widemann, E., Bruinsma, K., Walshe-Roussel, B., Rioja, C., Arbona, V., Saha, R. K., … & Grbić, V. (2021). Multiple indole glucosinolates and myrosinases defend Arabidopsis against Tetranychus urticae herbivory. Plant Physiology, 187(1), 116-132.
About the Author
 Raul López
Raúl studied Biotechnology at the Polytechnic University of Valencia, where he developed a strong interest in scientific research. He later specialized in food innovation before discovering his passion for bioinformatics. He is currently completing his Master’s in Bioinformatics at the University of Valencia, combining his background in biotechnology with skills in data analysis and software development.

