The differential expression (DE) analysis has been used in bulk RNA-seq analysis for many years. It allows us to statistically measure changes in gene expression levels between different groups. With bulk RNA-seq analysis many cells are sequenced at the same time, so gene expression levels are commonly measured at the tissue level. Thus, the differences between samples and conditions are tested at the tissue level as well. In contrast, Single-cell RNA-seq measures the expression cell by cell which adds more detail to the analysis.
As a result of this characteristic, it is possible to identify groups of cells with different expression patterns inside the tissues, which putatively correspond to different cell types. Applied to differential expression analysis, Single-cell RNA-seq not only allows to test between samples and conditions but also between cell types, thus adding more complexity to the analysis. Thanks to applying DE to Single-cell data, it is possible to look for differences in gene expression between. For example, healthy and ill donors at the cell type level.
Dataset
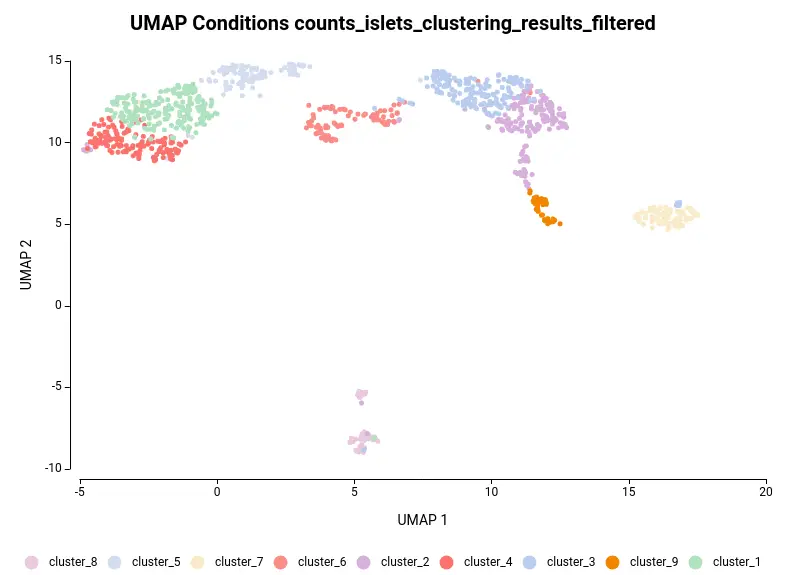
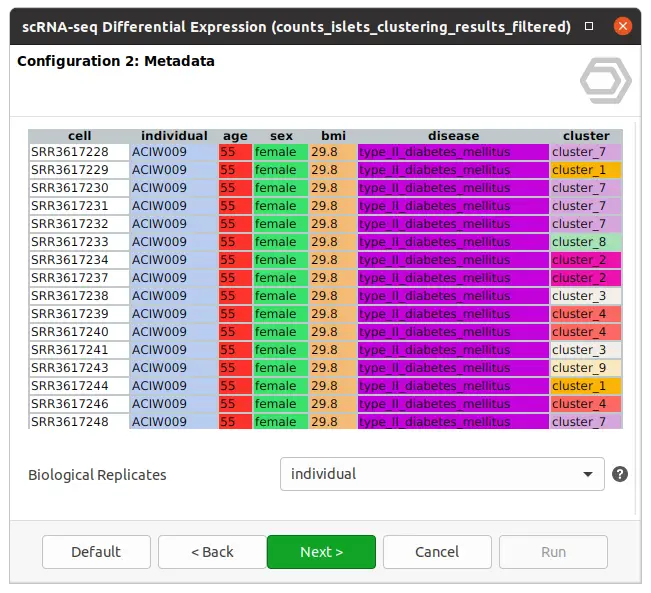
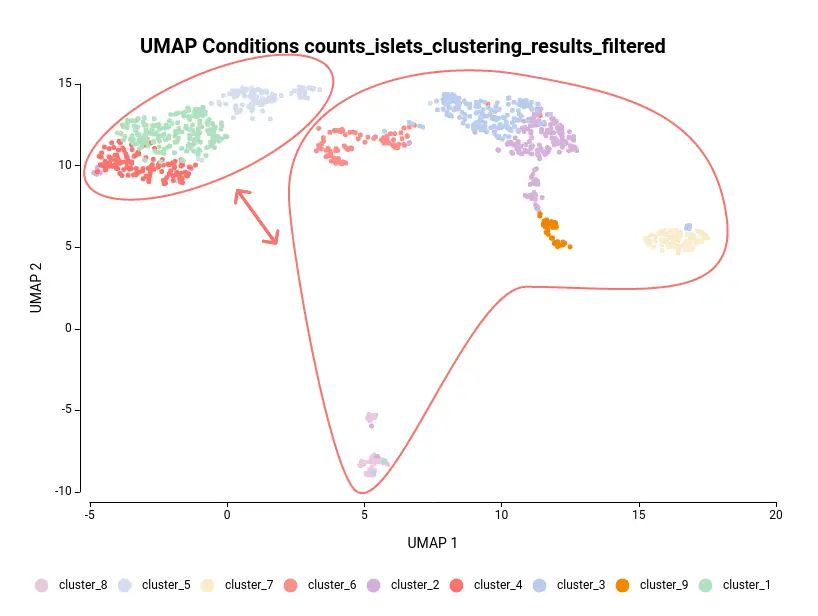
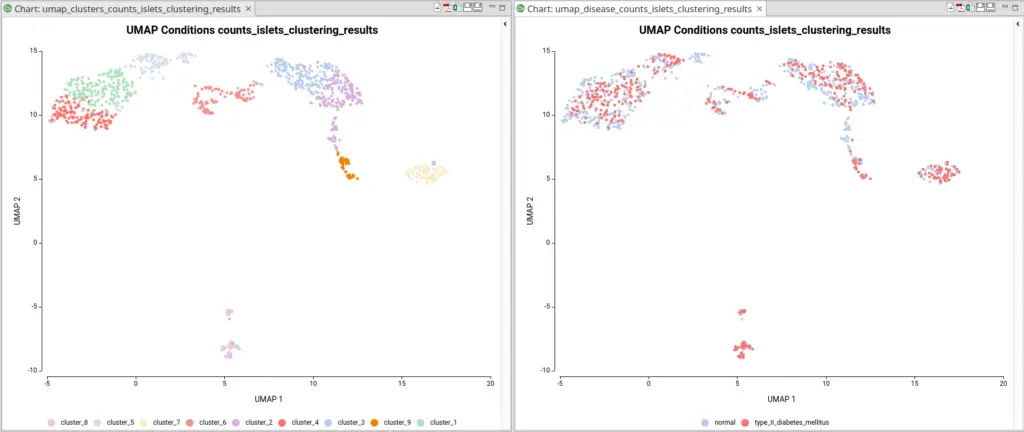
The dataset used in this post consists of human islet cells from healthy and diabetic donors (Lawlor N, et al., 2017). The Count Table was downloaded from the Single Cell Expression Atlas. Previous to the differential expression analysis, a Single-cell RNA-Seq Clustering was performed using OmicsBox, which resulted in 9 different clusters (Figure 1). Each cluster consists of a group of cells with similar expression patterns. In addition, a section of the experimental design is shown in Figure 2. Test for differential expression (DE) between the different groups of cells would give us an idea of the genes that are more expressed in each of the clusters.
How to design your scRNA-seq Differential Expression Analysis with OmicsBox
Depending on your data, your experimental design, and your objectives the design to use will change. This post is meant to help design the most appropriate configuration for your Single-cell RNA-seq Differential Expression Analysis using OmicsBox. Deciding on a good design could be complex but provides a more detailed vision of the samples analyzed. For a more detailed description of the algorithm, please visit the OmicsBox User Manual.
Single Design
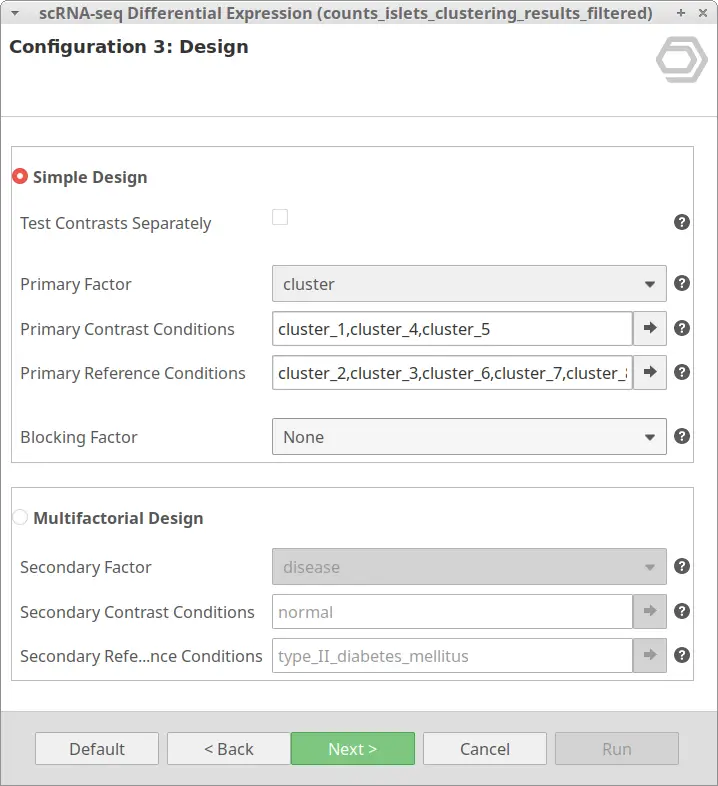
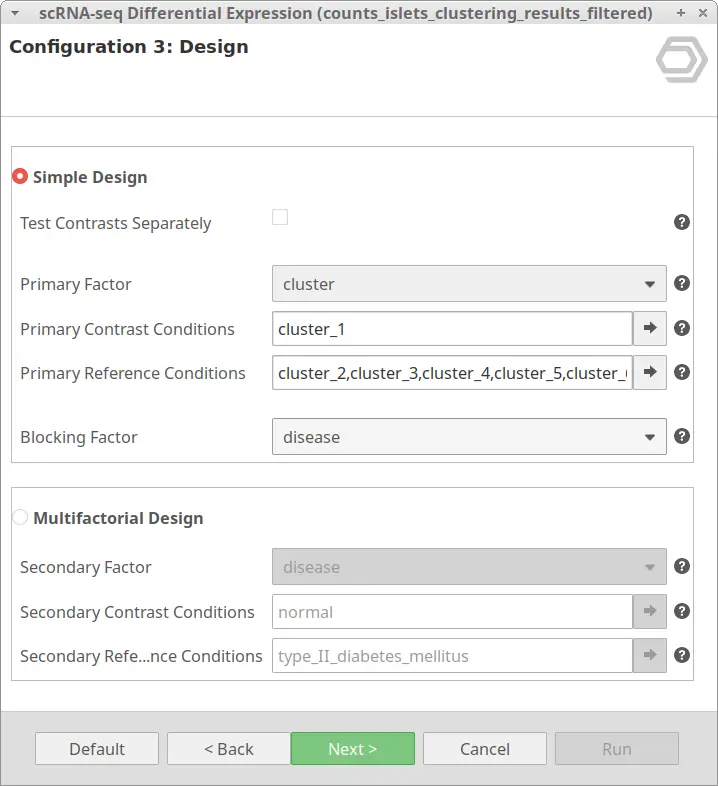
The “Simple Design” will test for differential expression taking only one experimental factor into account. With the default configuration, it tests the conditions in “Primary Contrast Conditions” together versus the conditions specified in “Primary Reference Conditions”.
The “Simple Design” is adequate in the case in which we are interested in testing between clusters or pseudotime ranges. Even if we have samples from different conditions, it may be interesting to test only between these groups of cells. Which supposedly correspond to different cell types. This would give us more information about the different cell types present in the sample, assumed to be present despite the condition.
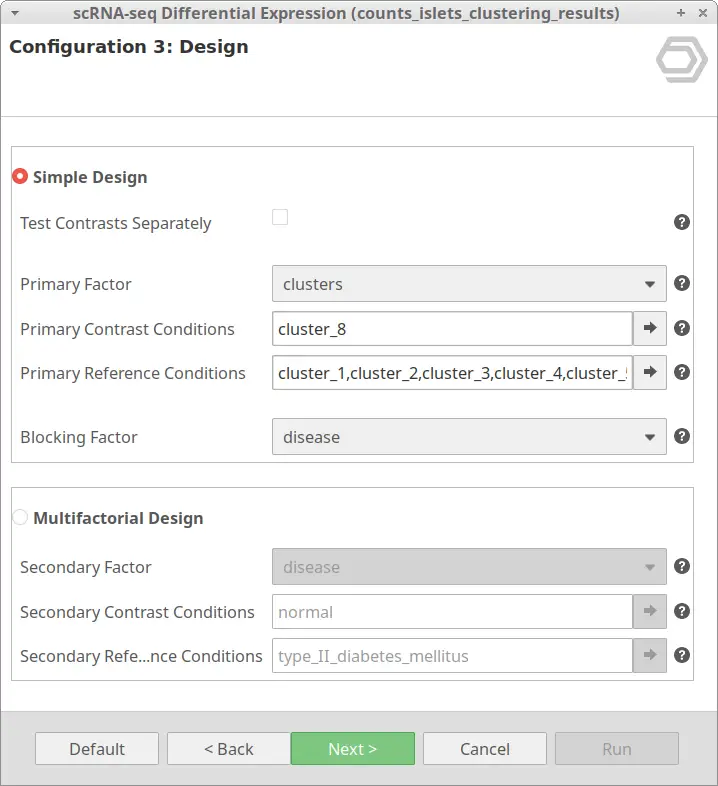
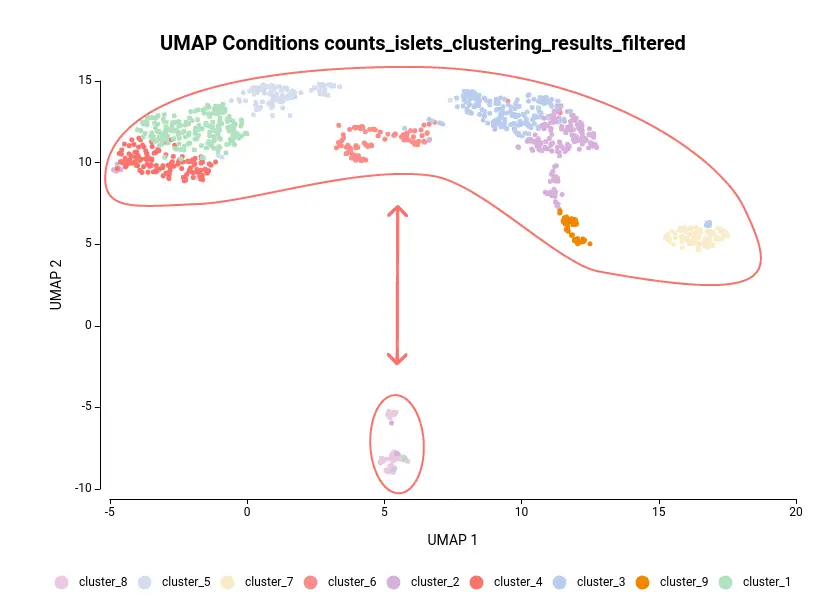
Let’s take the configuration shown in Figure 3 as an example. In this case, the “cluster_8” is selected as “Primary Contrast Condition” and the rest of the clusters as “Primary Reference Conditions”. So, it will test the “cluster_8” against the rest as shown in Figure 4.
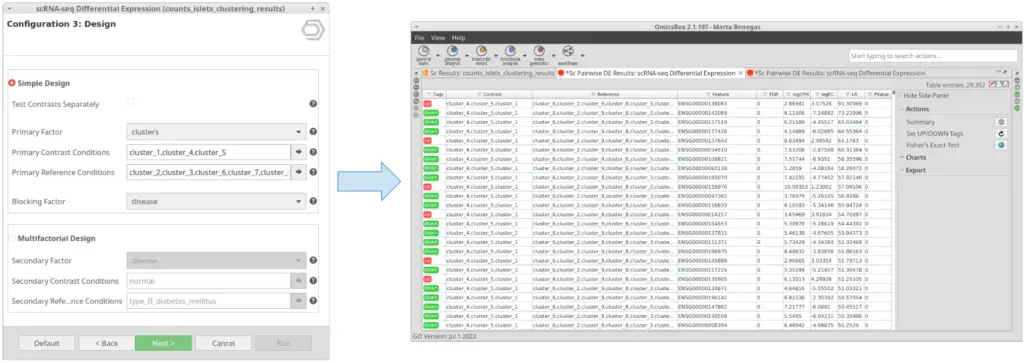
Another case scenario would be to test similar clusters together versus the rest. In our example, clusters 1, 4, and 5 appear together in the UMAP representation. That means that, although identified as different clusters, they have similar expression patterns. Thus it could be interesting to test them together versus the rest as shown in Figure 6. To achieve this, we should configure the analysis as shown in Figure 5.
Test Contrasts Separately
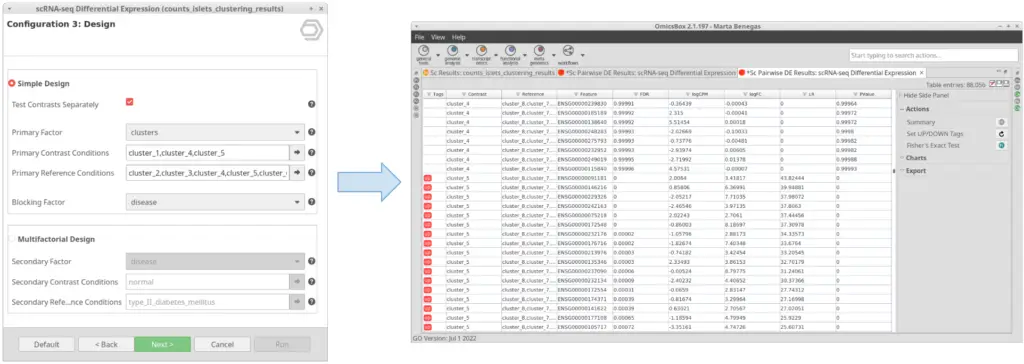
If this option is checked, instead of testing the conditions selected in “Primary Contrast Conditions” together (Figure 7), it will test them one by one against the rest (Figure 8). This is useful in case we want to perform the test exemplified in Figure 4 in one run instead of running the tool once for each of the clusters.
Blocking Factor
Adding a Blocking Factor could be interesting in the case we want to test for DE in the Primary Factor, but there is another factor that could be interfering with the results. By selecting a Blocking Factor, the algorithm adjusts for any baseline differences between the selected factor so the differences in the primary factor stand out as clearly as possible.
We are now interested in the differences between clusters in the islet cells example. However, this dataset contains cells coming from healthy and diabetic donors. This characteristic could alter the expression of the cells as well but, for now, we are interested in seeing the differences between cell types in spite of is condition. Under this scenario, it is recommendable to specify the factor “disease” in the “Blocking Factor”. With this configuration (Figure 9), the differences due to the health condition will be adjusted so they do not interfere with the DE between clusters.
Multiple Design
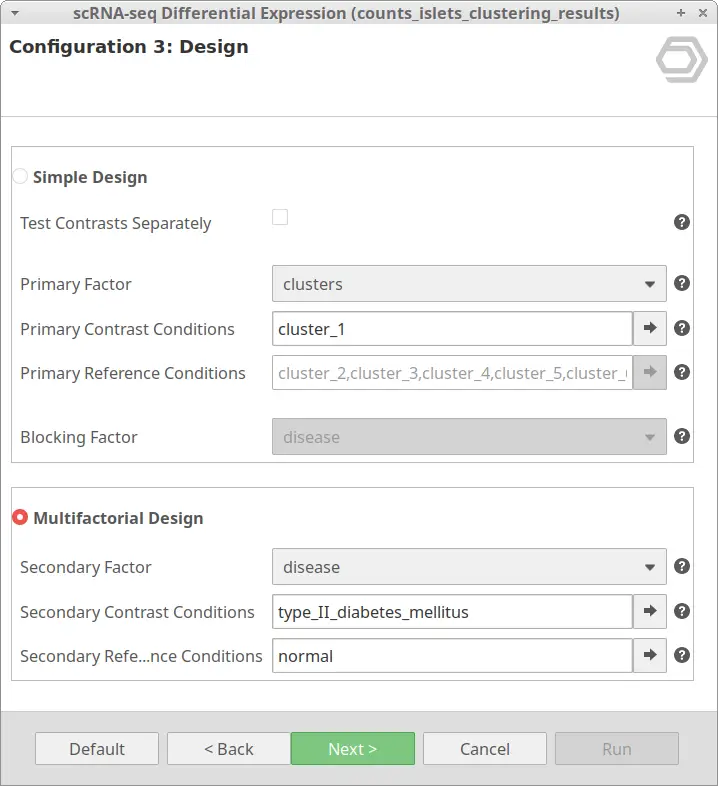
The “Multiple Design” is meant for testing DE between cells taking into account two factors. It tests the conditions selected in “Primary Contrast Conditions” in combination with the conditions in “Secondary Contrast Conditions” against the “Primary Contrast Conditions” in combination with “Secondary Reference Conditions”.
Please notice that, with this design, the “Primary Reference Conditions” is disabled. This is because only the cells belonging to the “Primary Contrast Conditions” will be tested. Inside the cells belonging to this group(s), the ones belonging to the “Secondary Contrast Conditions” will be tested against the cells belonging to the “Secondary Reference Conditions”.
For example, during the clustering analysis, if we have analyzed data coming from multiple conditions, the majority of the resulting clusters will be composed of cells coming from all conditions (Figure 10). The assumption is that most of the cell types present in a sample would be the same in spite of the condition. The difference between conditions would be in the gene expression and the abundance of those cell types.
Thus, going back to our example, it may be interesting to obtain the DE genes of cells belonging to the same cluster but under different conditions. For example, we may want to look at the differences between healthy and diabetic cells of cluster_1. This can be achieved with the configuration shown in Figure 11.
Test Contrasts Separately
The “Test Contrasts Separately” option works in the same way as with the “Simple Desing”. If checked, one DE test will be performed for each of the specified conditions. Otherwise, one DE test will be performed taking as contrast all the specified conditions together.
Blocking Factor
The “Blocking Factor” parameter is disabled since this option is not considered for this type of design.
Video Tutorial
Citations
Lawlor N, George J, Bolisetty M, et al. Single-cell transcriptomes identify human islet cell signatures and reveal cell-type-specific expression changes in type 2 diabetes. Genome Research. 2017 Feb;27(2):208-222. DOI: 10.1101/gr.212720.116. PMID: 27864352; PMCID: PMC5287227.

About the Author

Marta studied biotechnology at the Valencia Polytechnic University (UPV) and continued her studies with a Master's in Bioinformatics at the Autonomous University of Barcelona (UAB), Spain. After her master's degree, she started her professional career at Biobam where she is now working as a bioinformatics specialist and support manager.
At the moment she is mainly focused on Single-Cell technologies developing various pipelines which allow getting from reads to functional insights at a single-cell resolution. These developments are available in OmicsBox, BioBam’s software solution.
")
