Transcriptome analysis is a challenging bioinformatic problem. In eukaryotic transcriptomes, alternative splicing and alternative polyadenylation are the most complex issues. Genome-wide analysis of alternative splicing has been studied with short-read RNA sequencing for a while. Nevertheless, this technology needs a subsequent assembly, which is difficult to be resolved in ambiguities in complex loci.
How to overcome defects from short-read technologies?
In the last years, there has been increasing interest in the application of single-molecule sequencing to obtain full-length transcripts in animals and plants. Long reads represent full transcripts and eliminate the need for short-read assembly. One of the most important technologies to generate long reads is PacBio sequencing.
SQANTI3 is the third version of the Structural and Quality Annotation of Novel Transcript Isoforms implementation. This tool needs a previous step of PacBio Iso-Seq protocol, which consists of full-length cDNA enrichment. SQANTI3 uses these reads, together with the reference genome and its annotation, to achieve a deep transcriptome analysis and give the user a quality report and quality charts.
SQANTI3 steps to perform Transcriptome Analysis
SQANTI3 has two main steps in order to achieve a deep transcriptome analysis: quality control and characterization, and filtering.
Moreover, to have a deeper transcriptome analysis of the PacBio sequencing, it is highly recommended to annex additional information besides long-read data. First of all, some species have their poly-A motif and poly-A sites and/or their CAGE peak data annotated. With that data, SQANTI3 can analyse if sequenced transcripts are inside a poly-A site or a CAGE peak. In addition, it is highly recommended to use short-read files. If there is no availability of short-read fastQ files it is recommended to use short-read datasets from the same species, although they come from different experiments. With these short-read fastQ files, it is possible to use STAR alignment against the reference genome in order to validate and give support to splice junctions, and Kallisto pseudoaligner to calculate isoform relative expression.
Step #1. Quality Control and Characterization
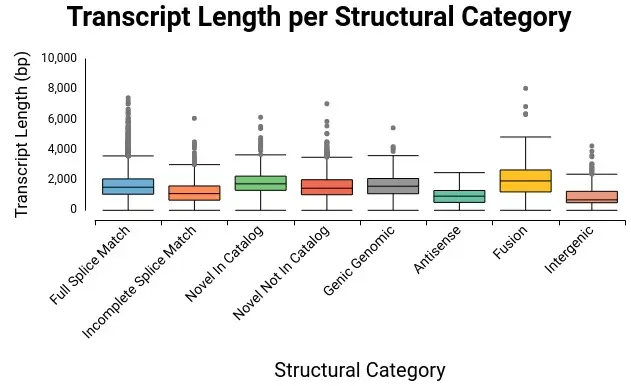
In this step, different structural categories of transcripts are found. These transcripts can be in annotated genes or in novel genes. The categories that are present, completely or partially, in known genes are Full Splice Match, Incomplete Splice Match, Novel In Catalog, Novel Not In Catalog, Genic Genomic, and Antisense. On the other hand, transcripts found in novel genes can be Intergenic or Genic Intron. To have more information about these structural categories visit SQANTI3 wiki.
To classify isoforms within these categories, SQANTI3 distinguishes among different types of splice junctions: known canonical, known non-canonical, novel canonical, and novel non-canonical.
Step #2. Filtering
The second step is a filtering step. SQANTI3 can filter out transcripts that are actually artifacts that appear because of RT-Switching or intrapriming (the intrapriming filter option removes transcripts with adenine stretches in the genomic position downstream from their 3′ ends). In the OmicsBox implementation, the filtering step has been set as optional, although it is highly recommended.
SQANTI3 in OmicsBox
-
The SQANTI3 implementation to generate a transcriptome analysis can be run in OmicsBox easily by just completing a few inputs and settings.
-
In addition, the IsoSeq3 protocol for PacBio sequencing can already be run in OmicsBox. Consequently, both steps can be run together in a simple workflow.
-
Once SQANTI3 is finished, OmicsBox returns different files: first of all, an information file with all transcripts and all the possible information that SQANTI3 can return, the curated transcriptome, and the translated transcriptome, optionally.
-
Moreover, OmicsBox displays a classification table with all transcripts and their main information, along with a report.
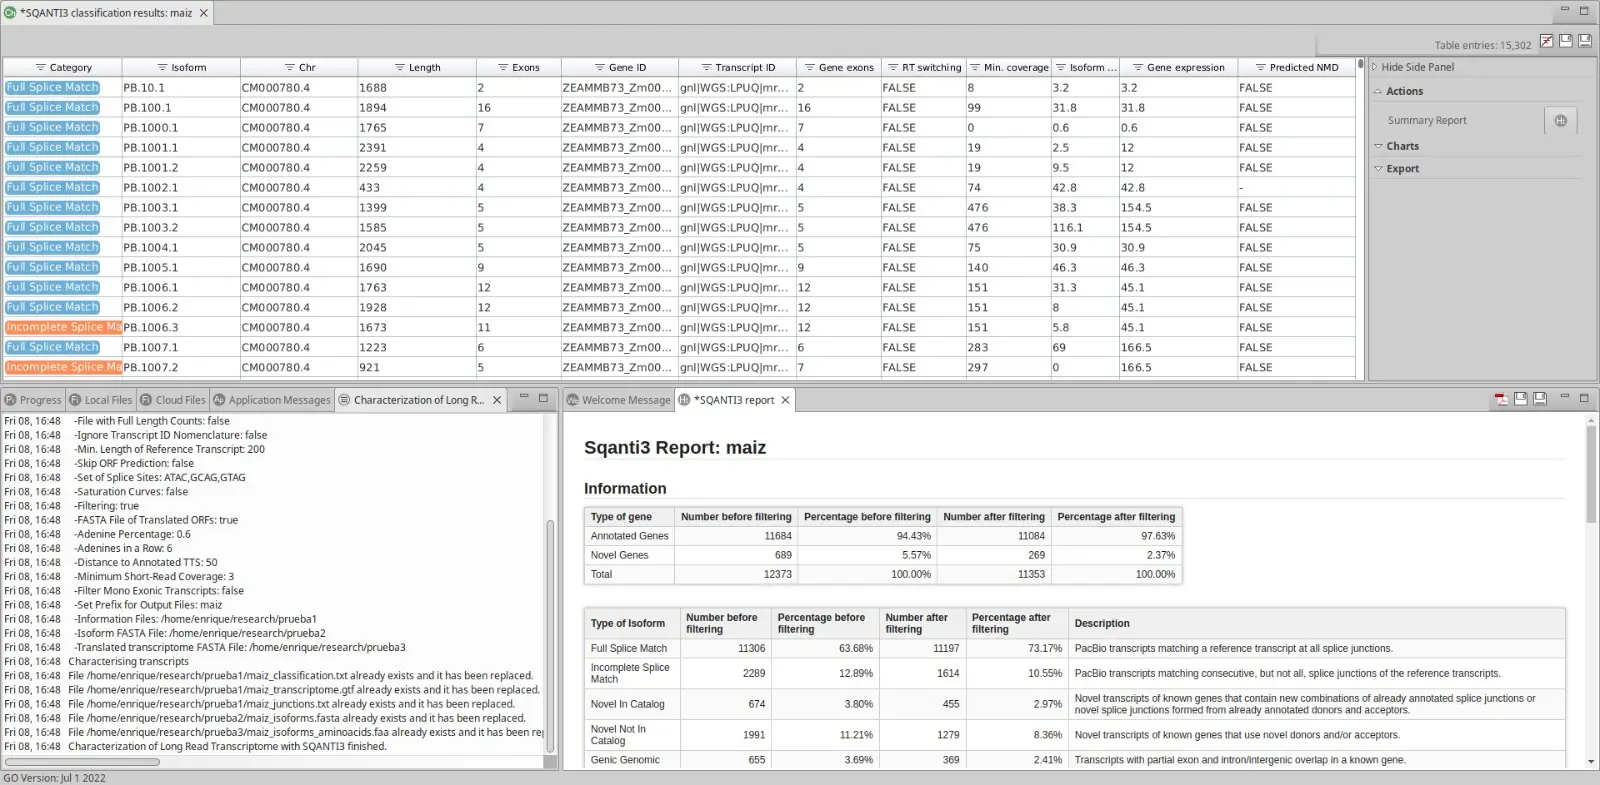
-
This table has a side panel where the user can choose different charts to be shown in order to have a direct insight of the transcriptome analysis done by SQANTI3. In addition, the user can extract into a separate FASTA file all those isoforms that are interesting using your own criteria.
-
With all this information, transcriptomes sequenced with long-read technologies can be curated to achieve better results in forward analysis.
Check out our mini-tutorial:
References
Tardaguila, M., De La Fuente, L., Marti, C., Pereira, C., Pardo-Palacios, F. J., Del Risco, H., … & Conesa, A. (2018). SQANTI: extensive characterization of long-read transcript sequences for quality control in full-length transcriptome identification and quantification. Genome research, 28(3), 396-411.
Useful links

About the Author

With a biological and technological academic background, including a BSc in Biotechnology and an MSc in Bioinformatics, Enrique's expertise lies in the areas of Long Reads and Genetic Variation.

