Genetic Variation studies often involve analyzing samples from a previously studied species. For instance, it is of interest to examine genomes of various cultivars, strains, or populations of the same species. In such cases, it may be necessary to perform de novo DNA-Seq assembly to obtain the genome of the sequenced organisms, even if a reference genome is available. To ensure the accuracy and reliability of the analysis, it is recommended to employ different assembly algorithms with varying configurations, as different datasets may require distinct analytical approaches.
In this regard, the QUAST tool proves useful, as it allows for easy comparison of different de novo assemblies. To illustrate its functionality, we will present several case studies utilizing a Caenorhabditis elegans WGS dataset. This dataset comprises short paired-end and mate-pair reads of the C. elegans N2 strain, enabling a thorough examination of QUAST’s features.
- SRA Study: DRP001005
- Reference Genome: WBcel235
Comparing different assembly algorithms: ABySS and SPAdes
Different assemblers employ various algorithms with diverse assumptions and procedures. As a consequence, the resulting assemblies will differ depending on the software utilized. At times, there is no single algorithm that performs optimally in all scenarios, and the efficacy could vary depending on the input data. In this section, we will evaluate the performance of ABySS and SPAdes using the C. elegans dataset. To this end, four distinct assemblies were generated:
- Using ABySS with paired-end reads
- Using ABySS with paired-end and mate-pair reads
- Using SPAdes with paired-end reads
- Using SPAdes with paired-end and mate-pair reads
QUAST Results
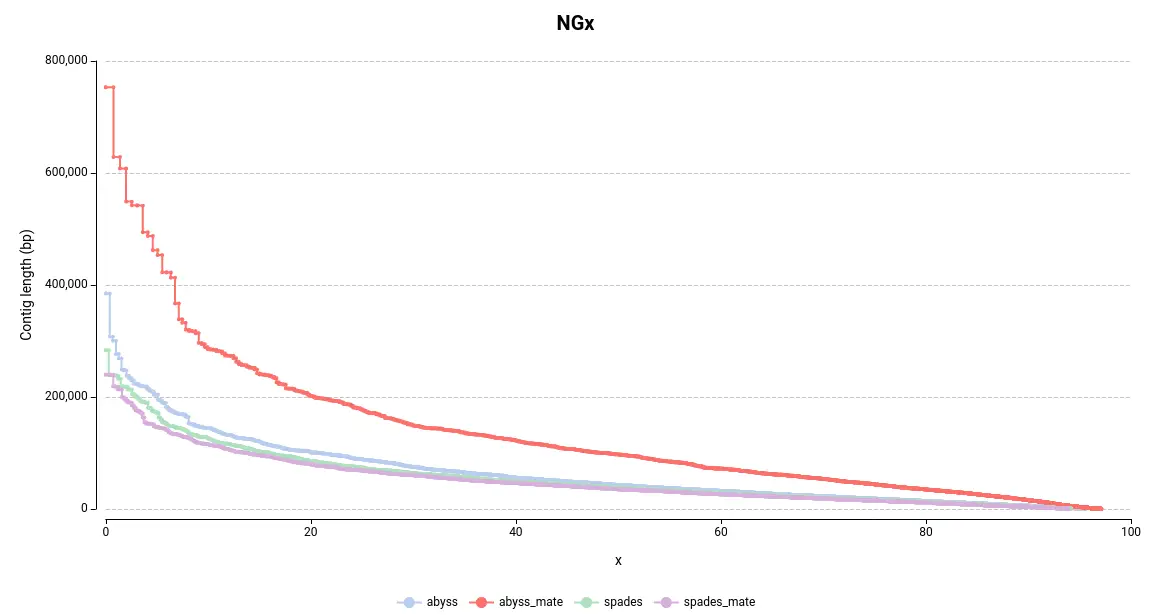
The NGx plot provides information on the size of the contigs. For example, an NG50 of 10bp indicates that 50% of the total reference genome size is covered by contigs longer than 10bp. The commonly used Nx statistic employs the assembly size rather than the genome size. However, since each assembly has a different length, the Nx is not directly comparable between assemblies. Therefore, the NGx is preferable for comparative purposes.
In general, larger contigs are desirable as they are more representative of the real chromosome or genome size. By examining the NGx plot, it is immediately evident that the assemblies generated using ABySS contain larger contigs (Figure 1). In particular, the combination of ABySS and mate-pair results produced notably better results. This is further supported by the length of the largest contig and the total assembly length (Table 1).
Another useful metric for evaluating the quality of an assembly is the Genome Fraction, which indicates the percentage of genomic bases covered by the assembly. This is measured by aligning the assembly to the reference genome. As shown in Figure 2, the assemblies generated using ABySS cover a larger portion of the reference genome. This is consistent with the total assembly size (Table 1), as a larger assembly has the potential to cover more of the genome.
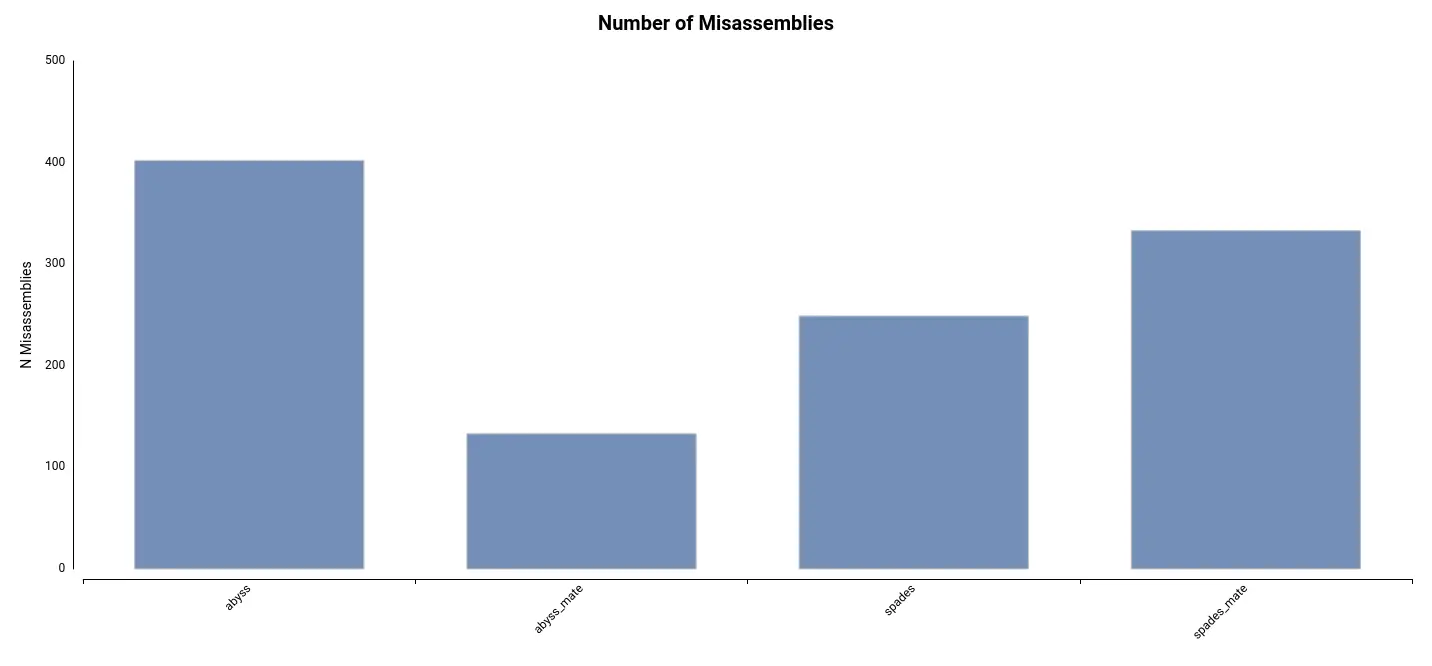
Lastly, the number of misassemblies detected can provide insight into the accuracy of the assembly. These regions of the assembly do not align with the reference genome. In this dataset, the number of misassemblies is comparatively lower in the assembly generated using ABySS and mate-pair reads (Figure 3).
In conclusion, after considering the different metrics, it can be inferred that the assembly generated using ABySS and mate-pair reads is more complete and accurate.
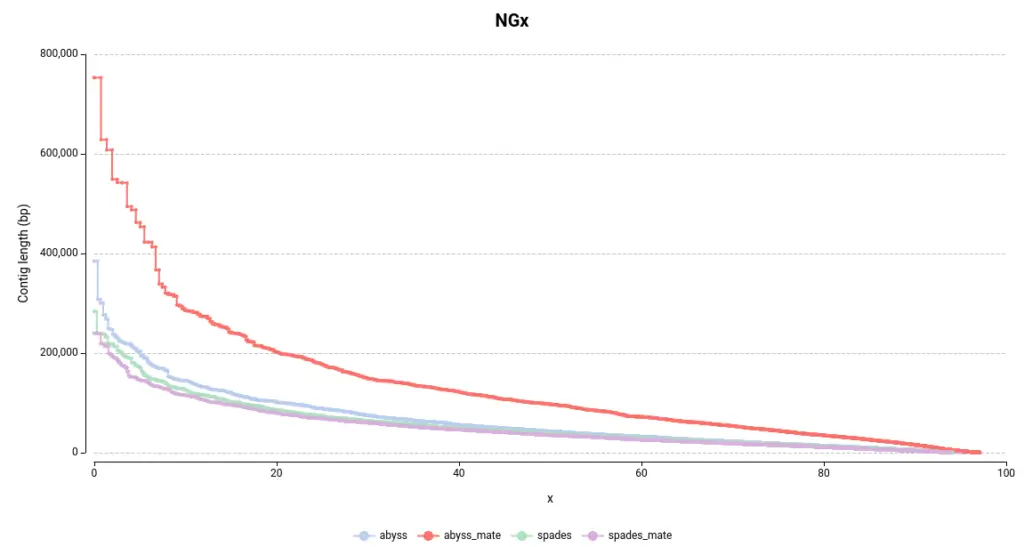
Figure 1. NGx Plot for the assemblies made with ABySS and SPAdes. 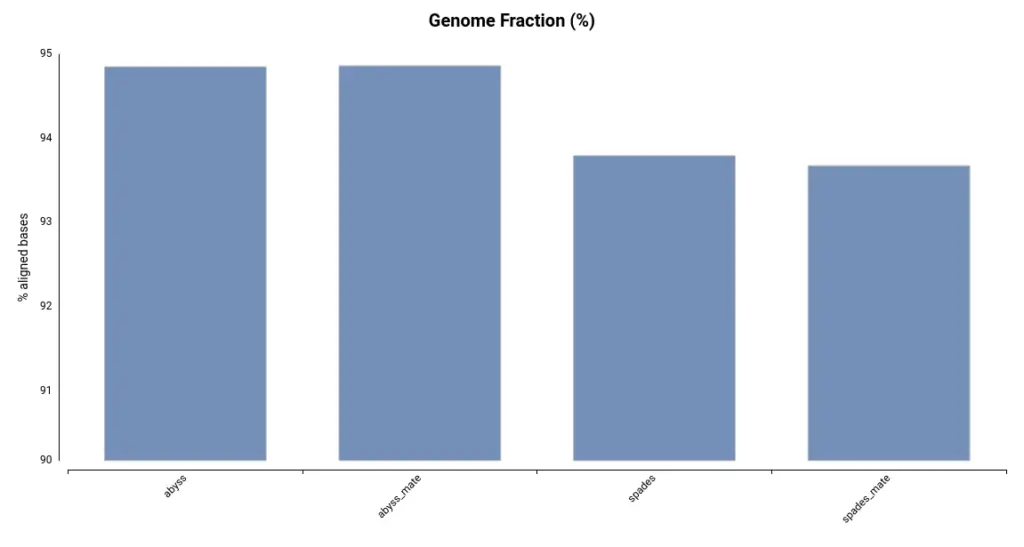
Figure 2. Genome Fraction for each of the assemblies. 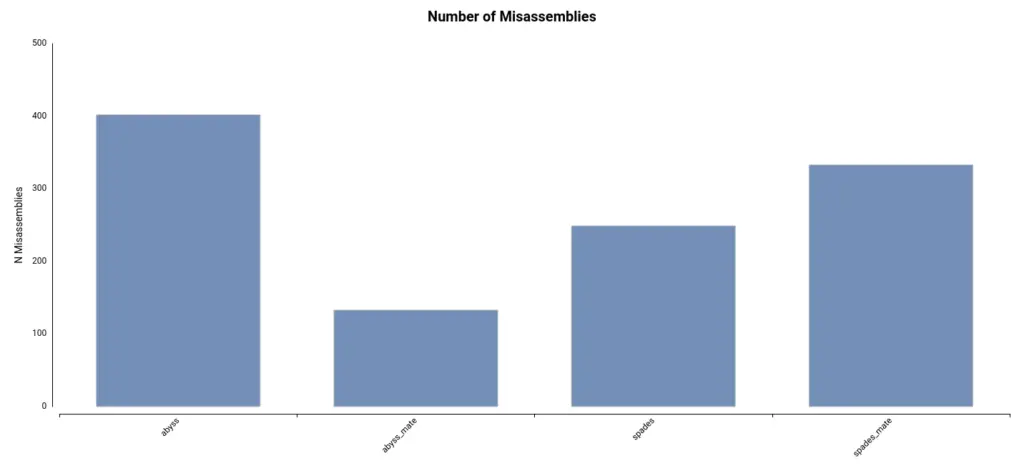
Figure 3. Number of Misassemblies detected for each of the Table 1. Summary statistics obtained by QUAST for each of the assemblies performed with different algorithms.
Statistic Abyss Abyss_mate Spades Spades_unpaired Num. contigs (>= 0 bp) 70674 68600 61459 63280 Num. contigs (>= 10000 bp) 2229 1393 2328 2377 Num. contigs (>= 50000 bp) 490 601 458 437 Num. contigs 5674 3654 5668 6112 Largest contig 384836 753101 283380 239865 Total length 95813155 97384272 94415625 239865 Reference length 100286401 100286401 100286401 100286401 auNG 62763.7 135616.3 54011.7 49442.1 Adding different mate-pairs or unpaired reads to the assembly
Both the quality and quantity of input data used can influence de novo assembly. Assembling algorithms aim to reconstruct the genome using only the input reads without the guidance of a reference genome, making the resulting assembly highly dependent on the input data. Generally, the more input data that is used, the better the assembly, but this is not always true if the provided data is erroneous.
This section investigates how the addition of mate-pair data and/or unpaired reads affects the assembly. Unpaired reads are reads that have lost their corresponding pairs during the FASTQ Preprocessing step, thus making them single-end reads. Some scientists suggest that unpaired reads, being short and potentially of lower quality, could introduce noise into the assembly. However, others argue that not using them results in the loss of valuable information.
Input Data
In order to assess this, a dataset consisting of a WGS of C. elegans has been assembled using ABySS. It has been done with four different sets of input data:
- Short paired-end reads
- Short paired-end reads + mate-pair reads
- Short paired-end reads + short unpaired (single) reads
- Short paired-end reads + short unpaired (single) reads + mate-pair reads
Then, the quality of the assemblies has been assessed and compared using the QUAST implementation available in OmicsBox.
QUAST Results
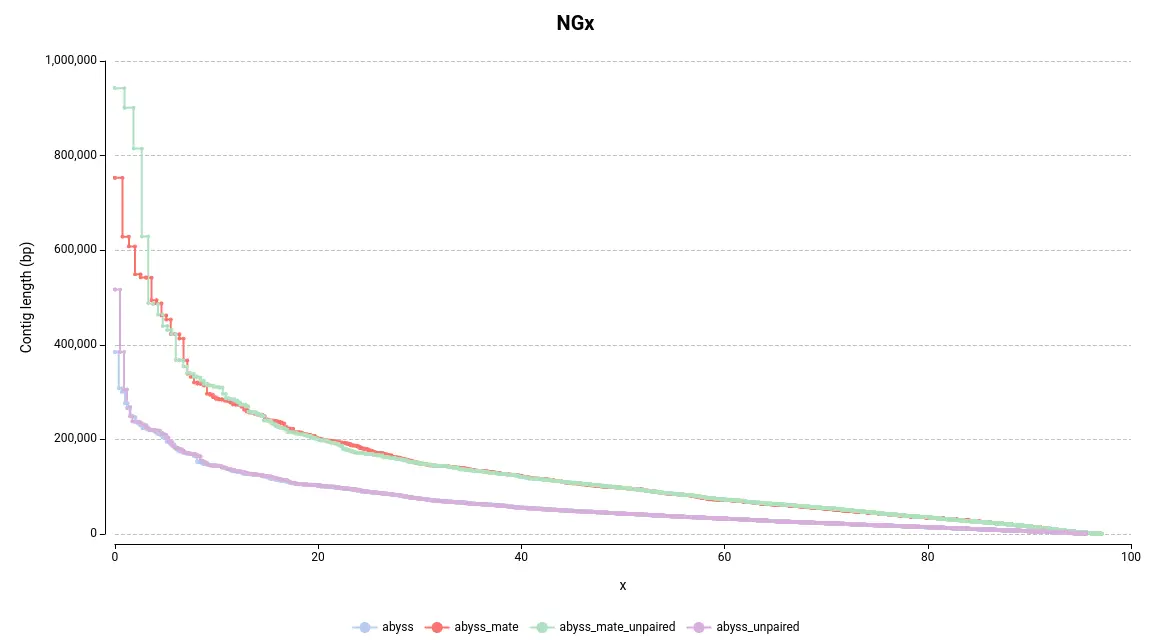
By examining Figure 4, the first observation is that assemblies generated with mate-pair data produce larger assemblies as the lines on the NGx plot are positioned higher on the Y-axis. Another way to assess this quickly is by examining the auNG (Table 2), which is the area under the NGx curve. Hence, the greater the auNG, the greater the NGx values.
This is further supported by some statistics presented in the Summary Report (Table 2). For instance, the number of large contigs (with a length >= 50k bp), the largest contig length, and the total assembly length are all higher in assemblies generated with mate-pair data.
Additionally, the number of misassemblies detected is substantially lower in assemblies generated with mate-pair reads (Figure 5).
Overall, there is a significant difference between using and not using mate-pair reads. This is logical since these reads are used specifically to enhance assemblies. Mate-pair reads provide long-range information, which can aid in scaffolding and connecting contigs generated from short-read sequencing data, as well as resolving ambiguities and errors in the assembly process.
Concerning the difference between adding or not adding unpaired reads, it can be observed that it helps to construct larger contigs in this instance (Table 2, Figure 4). However, the difference is not as significant as it is with using or not using mate-pair reads.

Figure 4. NGx Plot for the assemblies obtained with different input data. 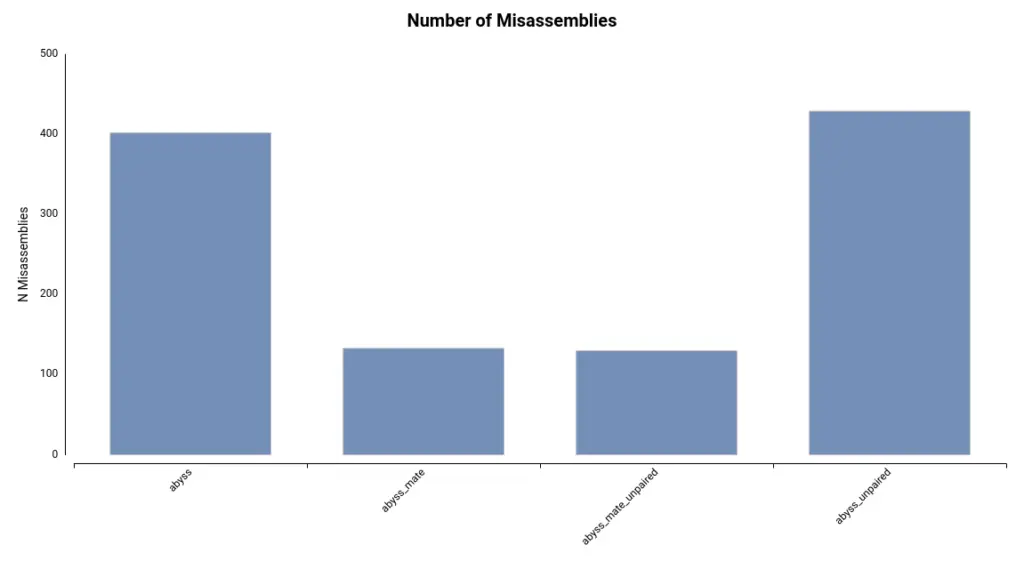
Figure 5. Number of Misassemblies detected for each of the assemblies. Table 2. Summary statistics obtained by QUAST for each of the assemblies obtained with different sets of input data.
Statistic Abyss Abyss_mate Abyss_mate_unpaired Abyss_unpaired Num. contigs (>= 0 bp) 70674 68600 85717 87640 Num. contigs (>= 10000 bp) 2229 1393 1396 2235 Num. contigs (>= 50000 bp) 490 601 613 478 Num. contigs 5674 3654 3644 5532 Largest contig 384836 753101 942534 516982 Total length 95813155 97384272 97379516 95812895 Reference length 100286401 100286401 100286401 100286401 auNG 62763.7 135616.3 141949.4 64254.4 Trying different k-mer sizes
Even using the same algorithm and input data, the resulting assembly can be really different when specifying different parameters. In particular, one parameter that largely affects the assembly is the k-mer size. In a de novo genome assembly, k-mers are short, contiguous sequences of length k (usually ranging from 20-150 nucleotides) that are extracted from the sequencing reads. The k-mer size is an important parameter in the assembly process, as it determines the level of sensitivity and specificity in detecting overlaps and assembling contigs.
Input Data
The length of the reads for the C. elegans dataset is 110bp. In this section, we will assess the performance of using three different k-mer lengths:
- 55bp kmer size, which is 50% of the read length.
- 77bp kmer size, which is 70% of the read length.
- 25bp kmer size, which is ~23% of the read length.
QUAST Results
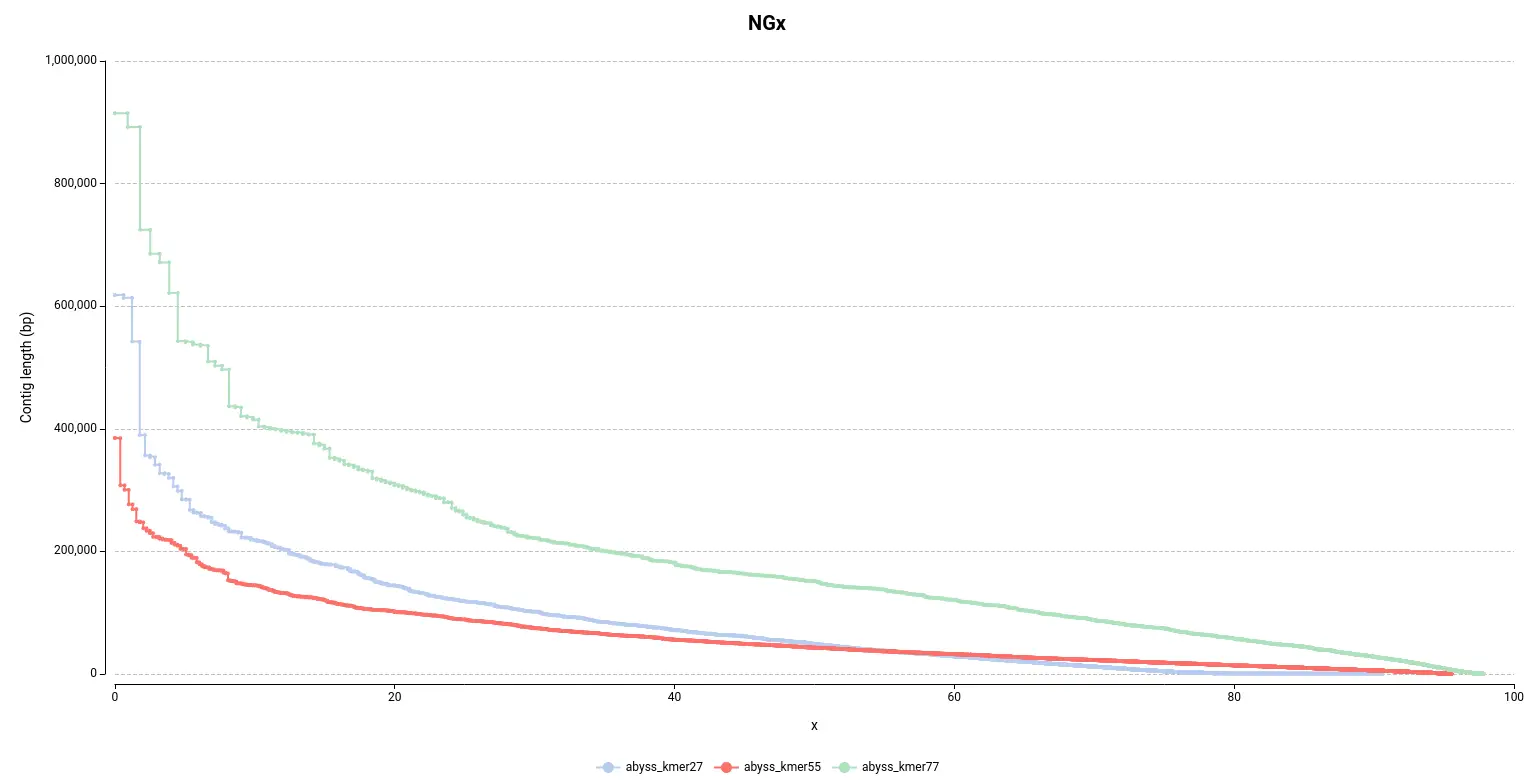
As in the other section, it is easy to see in the NGx plot (Figure 6) that the assembly obtained with a kmer size of 77 contains bigger contigs, which is desirable. Surprisingly, it seems that the default configuration (55 kmer size) is the assembly that performed the worst since it is made of smaller contigs.
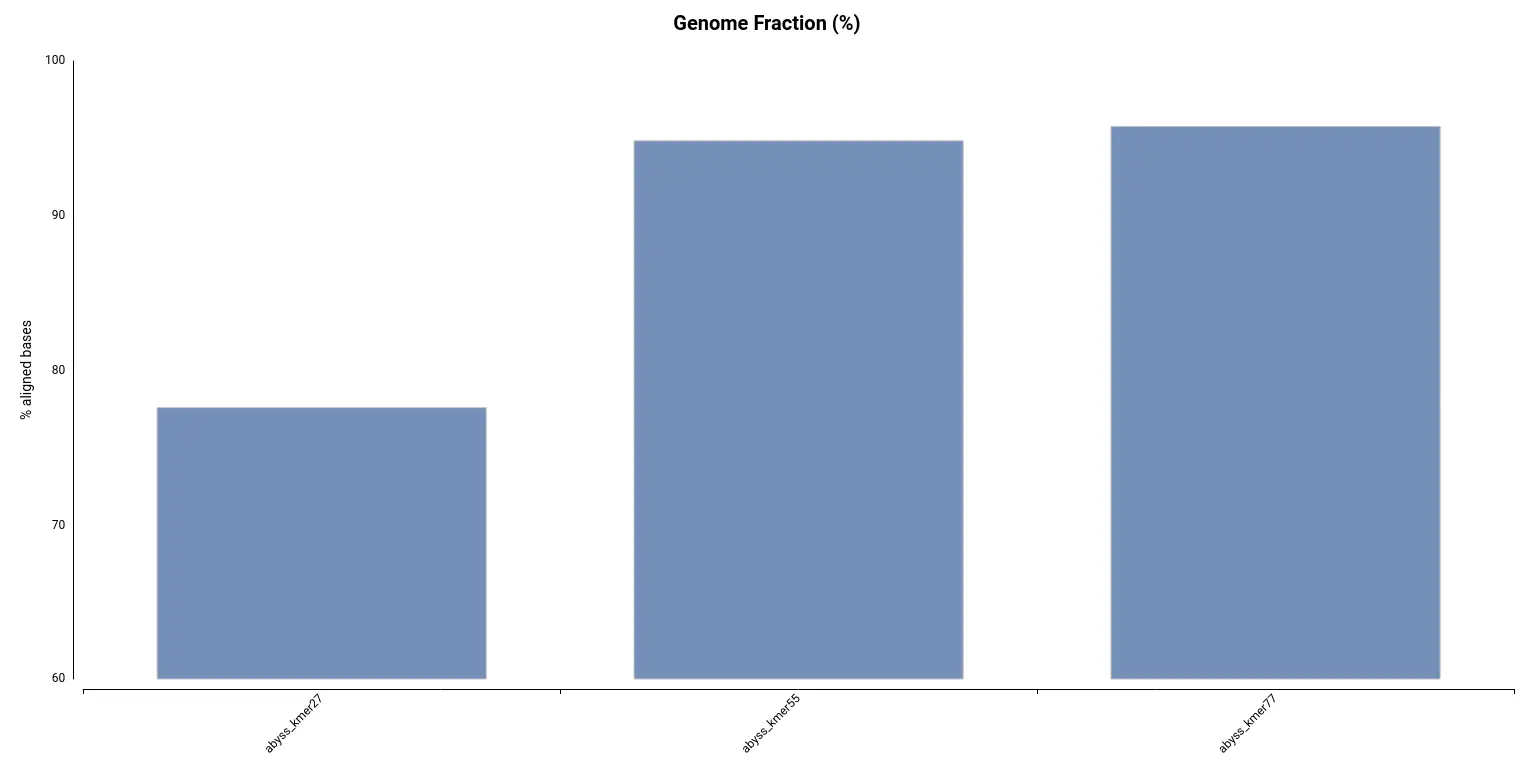
However, by looking at the Genome Fraction (Figure 7), we see that the assembly obtained with a kmer size of 27 covers a smaller percentage of the reference genome. Say it in another way, even if contigs are bigger, the assembly is less complete in comparison with the assembly obtained with a kmer size of 55. It is also evidenced by the total assembly length (Table 3); the smaller assembly is obtained with a kmer length of 27. This exemplifies how important is to look into different statistics in order to evaluate an assembly.
Moreover, the total number of contigs (Num. contigs (>= 0 bp) in Table 3) it’s quite higher in the abyss_kmer27 assembly. Thus, it seems that there is a high number of tiny contigs that the algorithm was not able to join in bigger sequences, in comparison with the other two assemblies.
Finally, it turns out that the assembly with a higher number of misassemblies is the one obtained with a kmer length of 55 (Figure 8), which is the default configuration. Thus, in conclusion, it seems that a kmer size of 77 gave the best results.
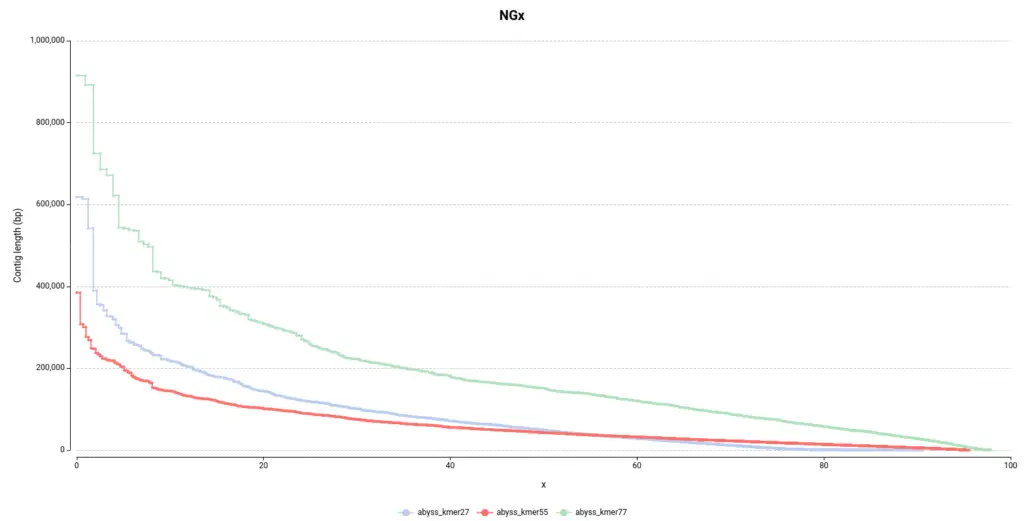
Figure 6. NGx plot for the assemblies obtained with different kmer sizes. 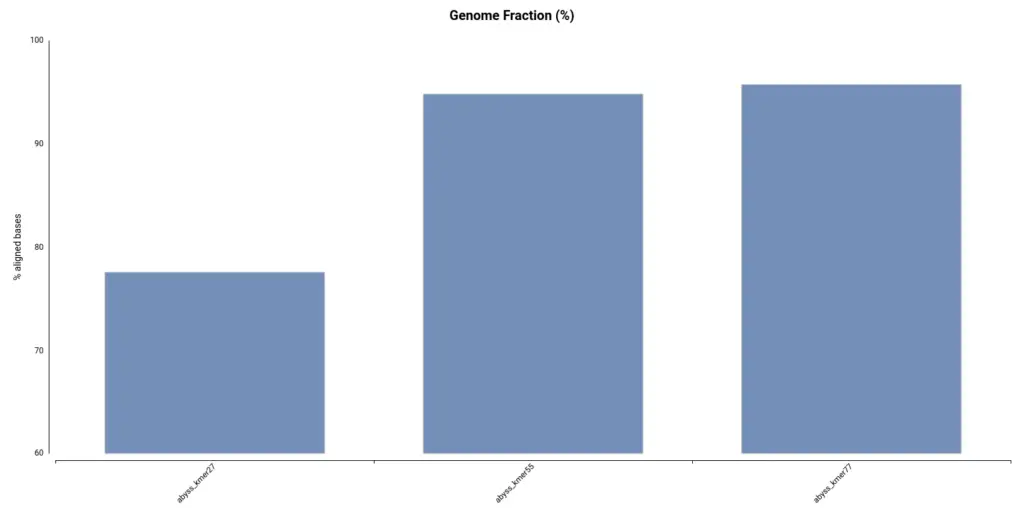
Figure 7. Percentage of the genome covered by each of the assemblies. 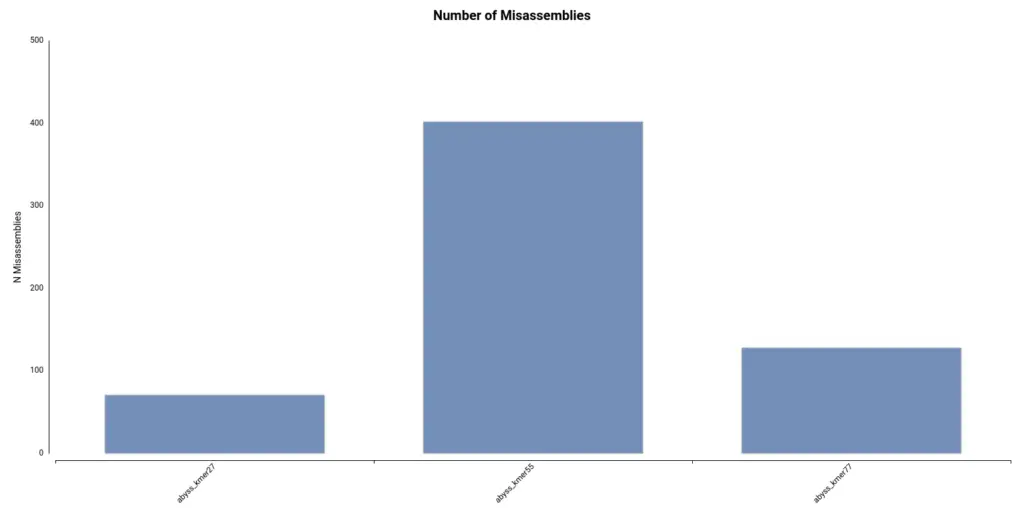
Figure 8. The number of misassemblies detected for each of the assemblies. Table 3. Summary statistics obtained by QUAST for each of the assemblies obtained with different k-mer sizes.
Statistic Abyss_kmer27 Abyss_kmer255 Abyss_kmer77 Num. contigs (>= 0 bp) 479663 70674 53279 Num. contigs (>= 10000 bp) 1375 2229 1009 Num. contigs (>= 50000 bp) 452 490 553 Num. contigs 20530 5674 2641 Largest contig 618279 284836 914631 Total length 90902996 95813155 98116581 Reference length 100286401 100286401 100286401 auNG 84684.1 62763.7 197579.9 
Useful links
References
Bolger, A.M., Lohse, M. and Usadel, B. (2014) “Trimmomatic: A flexible trimmer for Illumina sequence data,” Bioinformatics, 30(15), pp. 2114–2120. Available at: Trimmomatic: a flexible trimmer for Illumina sequence data .
Gurevich, A. et al. (2013) “Quast: Quality Assessment Tool for Genome Assemblies,” Bioinformatics, 29(8), pp. 1072–1075. Available at: QUAST: quality assessment tool for genome assemblies .
Jackman, S.D. et al. (2017) “Abyss 2.0: Resource-Efficient Assembly of large genomes using a bloom filter,” Genome Research, 27(5), pp. 768–777. Available at: ABySS 2.0: resource-efficient assembly of large genomes using a Bloom filter .
Li, H. 2020 Aun: A new metric to measure assembly contiguity, Sitewide ATOM. Available at: auN: a new metric to measure assembly contiguity (Accessed: February 27, 2023).
Prjibelski, A. et al. (2020) “Using Spades de Novo Assembler,” Current Protocols in Bioinformatics, 70(1). Available at: https://doi.org/10.1002/cpbi.102.
About the Author
 Marta Benegas
Marta studied biotechnology at the Valencia Polytechnic University (UPV) and continued her studies with a Master's in Bioinformatics at the Autonomous University of Barcelona (UAB), Spain. After her master's degree, she started her professional career at Biobam where she is now working as a bioinformatics specialist and support manager. At the moment she is mainly focused on Single-Cell technologies developing various pipelines which allow getting from reads to functional insights at a single-cell resolution. These developments are available in OmicsBox, BioBam’s software solution.