The functional interpretation of differentially expressed genes obtained from RNA-seq data is a critical step in elucidating the intricate biological mechanisms underlying complex biological processes. Pathway analysis has emerged as a powerful approach to gaining insights into the coordinated interactions among genes within biological pathways. However, a major challenge in pathway analysis lies in the availability of annotation data, which is predominantly focused on model organisms or commonly studied species.
Consequently, the analysis of datasets derived from lesser-known organisms, including those possessing extraordinary regenerative abilities like salamanders, is impeded. Salamanders have captivated scientific interest due to their remarkable capacity for limb regeneration, making them an intriguing subject of investigation. However, the analysis of salamander datasets is further complicated by the lack of comprehensive annotation data. To address this type of limitation, OmicsBox 2.0 introduced the Combined Pathway Analysis feature that empowers researchers to analyze datasets from non-model organisms without functional annotations. The following study is based on an analysis conducted by Arenas Gómez et al. in 2018 (doi: https://doi.org/10.1186/s12864-018-5076-0), wherein transcriptomics data was employed to investigate the intricacies of limb regeneration in the salamander species Bolitoglossa ramoni. Additionally, we performed a KEGG and Reactome pathway analysis on this dataset using OmicsBox, aiming to enhance the understanding of the underlying molecular pathways involved in salamander limb regeneration. By overcoming the limitations imposed by missing annotations, this innovative approach enables a comprehensive and in-depth functional interpretation of differentially expressed genes derived from RNA-seq data in non-model organisms.
Objectives
The main goal of this study is twofold. Firstly, we aim to replicate the original study pipeline using the OmicsBox set of tools, specifically utilizing the Functional Analysis and Transcriptomics modules [3]. This involves obtaining sequencing data and performing a comprehensive differential expression analysis. By replicating the original pipeline within OmicsBox, we can establish a solid foundation for further analysis and ensure comparability with the findings of the original study.
Secondly, we conducted an additional combined pathway analysis step using only the sequence data obtained from the previous analysis and without relying on species-specific annotation information. This approach allows us to overcome the challenge of incomplete pathway annotation data, which is particularly prevalent in the case of lesser-known organisms like salamanders. By leveraging OmicsBox’s powerful pathway analysis tools, we aimed to detect the molecular pathways that may be associated with salamander limb regeneration.
Data Collection and Preprocessing
In the original study, the authors conducted data collection by measuring RNA-seq transcriptomics data from various tissues both before amputation and during the process of limb regeneration, specifically from the regenerating tissue known as the blastema. The collection of samples occurred at four distinct time points following amputation, namely 20, 40, 60, and 70 days. This comprehensive sampling strategy allowed for the assessment of gene expression dynamics throughout different stages of the regenerative process.
|
Sample Name |
Replicate |
Tissue |
Time |
Condition |
|
SRR6192592 |
1 |
Limb |
0 |
Control |
|
SRR6192593 |
2 |
Limb |
0 |
Control |
|
SRR6192594 |
3 |
Limb |
0 |
Control |
|
SRR6192595 |
1 |
Blastema |
20 |
Regenerative |
|
SRR6192596 |
1 |
Blastema |
40 |
Regenerative |
|
SRR6192597 |
1 |
Blastema |
60 |
Regenerative |
|
SRR6192598 |
2 |
Blastema |
60 |
Regenerative |
|
SRR6192599 |
1 |
Paletta |
70 |
Regenerative |
|
SRR6192601 |
1 |
Gut |
0 |
– |
|
SRR6192600 |
1 |
Skin |
0 |
– |
Table 1: The table shows the samples and the underlying experimental design.
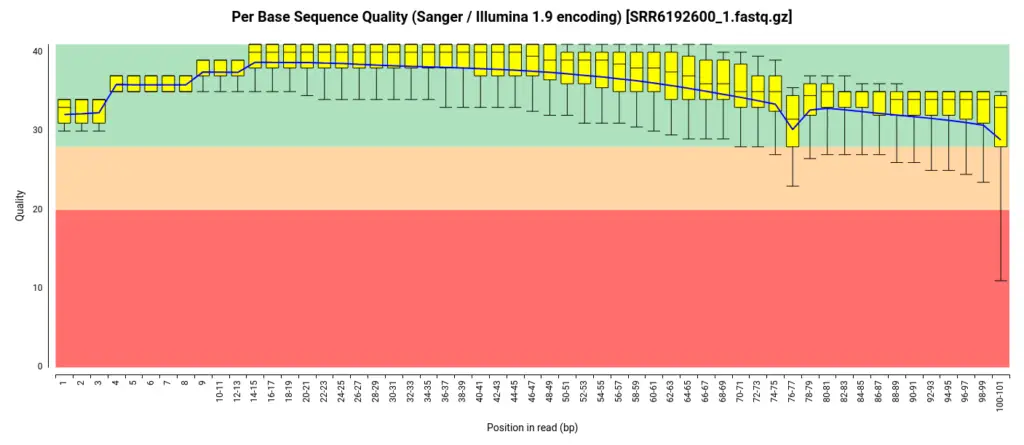
To obtain the raw data for this analysis, we downloaded the FASTQ files from the SRA (Sequence Read Archive) repository, which served as the source of the original study’s data. Before proceeding with the analysis, we performed an initial quality assessment of the downloaded FASTQ files. For this purpose, we employed the FastQ Quality Control tool available in OmicsBox [4]. The assessment revealed that the per-base quality scores were consistently high throughout the reads, indicating excellent sequencing quality. Additionally, the analysis indicated that the adapter content within the files was minimal, suggesting that the original data had likely undergone preprocessing steps such as adapter trimming before being uploaded to the repository. Consequently, we determined that further trimming and adapter removal steps were unnecessary, and we proceeded with the analysis using the unaltered FASTQ files.
De-Novo Transcriptome Assembly
We employed all available reads, encompassing those obtained from both the limb tissue and other swabbing sites, as the input for RNA-Seq De Novo Assembly within OmicsBox [5]. The assembly process utilized the default Trinity options as outlined in the original paper. Following assembly, contigs with a length below 200 were discarded to eliminate shorter and potentially less reliable sequences. To mitigate redundancy in the assembled transcriptome, an additional clustering step was performed using CD-HIT [6] available also via OmicsBox. This clustering step aids in reducing the number of redundant sequences, thereby refining the transcriptome assembly and improving downstream analyses.
Contaminant Removal
In the original study, the authors employed Reciprocal Best Hits of translated Blast searches (RBH-Blast) using a custom database to identify and eliminate potentially contaminant contigs from the reference transcriptome. The custom database consisted of sequences from viruses, bacteria, fungi, and single-celled eukaryotes, as well as ribosomal and mitochondrial salamander sequences that were not relevant to the analysis. In our analysis, we adopted an alternative approach for contaminant removal.
Initially, we utilized Kraken from the Metagenomics Module of OmicsBox [7,8,9], a powerful tool for taxonomic classification, to identify sequences associated with external organisms. By running Kraken, we could effectively assess the taxonomic composition of the assembled transcriptome and identify any sequences originating from potential contaminants. Kraken’s comprehensive reference databases and robust classification algorithm enabled us to confidently differentiate between salamander-specific sequences and those derived from extraneous sources. This step allowed us to effectively pinpoint and eliminate potentially contaminant contigs, ensuring the integrity and purity of our reference transcriptome for subsequent analyses.
|
Taxa |
Count |
% |
|
Eukaryota |
61246 |
65.62 |
|
Bacteria |
30549 |
32.73 |
|
Archaea |
1013 |
1.09 |
|
Viruses |
526 |
0.56 |
Following the taxonomic classification using Kraken, we extracted and saved sequences categorized as “unknown” or belonging to the animal kingdom based on the Kraken results table. Any sequences identified as originating from microorganisms were discarded, ensuring the exclusion of potential contaminants.
Subsequently, we performed a BLAST search of the selected non-microorganism sequences against a custom database comprising solely ribosomal and mitochondrial salamander protein sequences. Any positive matches obtained from this comparison were excluded from further analysis. This step aimed to eliminate sequences associated with ribosomal and mitochondrial components, focusing solely on the unique protein-coding sequences within the salamander transcriptome.
The resulting filtered sequences constituted our reference transcriptome, consisting of high-quality, non-microorganism, and non-ribosomal/mitochondrial sequences. Notably, in this study, we deliberately omitted the functional annotation step employed in the original study. This deliberate omission allowed us to examine the software’s capability to perform pathway analysis solely using raw sequence data, without any prior functional information. By bypassing functional annotation, we sought to assess the software’s ability to uncover meaningful biological pathways based solely on the sequence data, thus demonstrating its potential for pathway analysis in the absence of prior functional knowledge.
Transcript Abundance and Differential Expression Analysis
To quantify transcript abundance, we utilized RSEM [10] within OmicsBox, leveraging the limb input reads. This analysis generated a transcript-level quantification table, providing valuable information on the relative abundance of transcripts within the salamander limb dataset.
Following transcript abundance quantification, we performed a pairwise differential expression analysis using EdgeR [11]. This analysis aimed to compare the regenerative state to the control condition, with the 60-day post-amputation time point and time 0 serving as the reference points for comparison.
By applying a significance threshold of FDR < 0.05 and an absolute logFC > 1, we identified a total of 1064 differentially expressed (DE) genes. These DE genes were distributed as follows: 407 genes were found to be up-regulated (logFC > 1), while 657 genes were down-regulated (logFC < -1). This analysis provided insights into the transcriptional changes occurring during salamander limb regeneration, highlighting genes that are differentially expressed in response to the regenerative process.
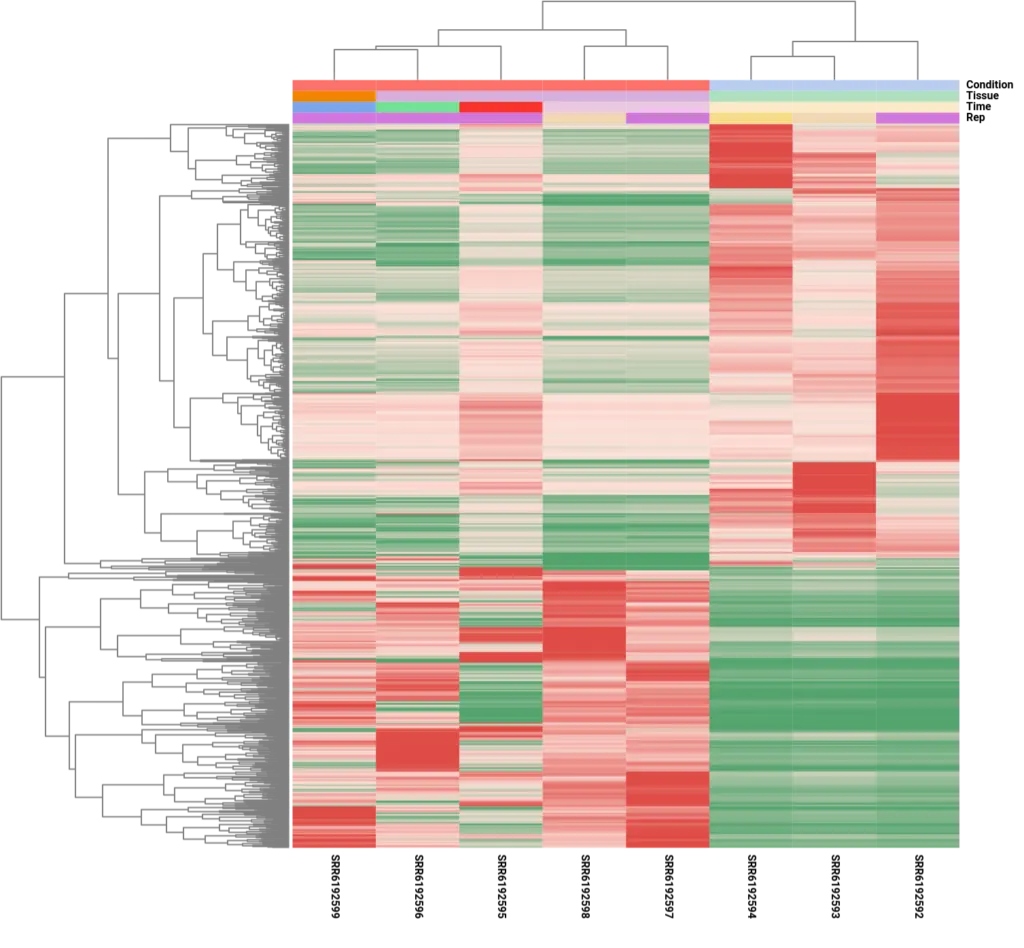
It is important to note that although the analysis focused on comparing the control condition to a single post-amputation time point, specifically the 60-day time point, the resulting differential expression patterns showed consistency across other time points. This observation was evident in the heatmap analysis, which depicted similar expression patterns for the DE genes across different time points, except for the 20-day sample (SRR6192595). The divergent expression pattern at the 20-day time point suggests the involvement of a distinct set of genes during the early stages of limb regeneration, indicating dynamic gene expression changes throughout the regenerative process.
Combined Pathway Analysis
The pathway analysis conducted in OmicsBox follows a two-step approach, encompassing sequence-to-pathway mapping and subsequent enrichment analysis:
In the first step, sequences are linked to pathways using protein identifiers via BLAST [12] or EggNog [13], and/or Gene Ontology (GO) and Enzyme Commission (EC) terms, depending on the initial annotation project file and configuration options. This step establishes the connection between the input sequences and the relevant biological pathways.
The second step entails conducting enrichment analysis using Fisher’s exact test [14] and/or Gene Set Enrichment Analysis (GSEA) [15]. This analysis ranks pathways based on their statistical significance, taking into account the list of differentially expressed genes identified in the previous analysis. The outcome of this step is greatly influenced by the selection of differentially expressed genes, as they provide crucial information for pathway enrichment.
In this particular case study, we utilized the default configuration options in OmicsBox for the pathway analysis, with two specific exceptions. Firstly, the “Reactome” options were adjusted to prioritize the Xenopus tropicalis organism as the closest related species available, enhancing the relevance of the pathway analysis results. Secondly, the “Plant Reactome” database was disabled, focusing the analysis exclusively on pathways relevant to the organism under investigation.
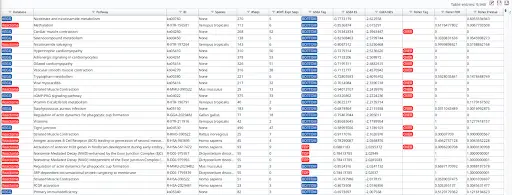
The results of the OmicsBox pathway analysis provide valuable information at multiple levels. At the first level, a comprehensive table is generated, displaying pathway names and categories, which reveal the biological processes represented by the sequences included in the input project. This initial assessment is independent of the differential expression analysis and encompasses all pathways associated with the organism, provided a sufficient number of sequences are included.
The second level of information is delivered through pathway diagrams, which present a graphical representation of each pathway, detailing the reactions and interactions involved. This visual format enables a more detailed examination of the pathway, facilitating a deeper understanding of its molecular mechanisms.
In this case study, the entire de-novo transcriptome was used as input for the pathway analysis, identifying all possible pathways associated with the available source databases. Since the project involved a differential expression analysis, the pairwise comparison of the 60-day post-amputation samples against the control was utilized, focusing the pathway analysis on the changes specific to the regenerative state.
The combined pathway analysis in OmicsBox offers a comprehensive exploration of the biological processes and pathways underlying the studied condition, providing a valuable resource for uncovering potential regulatory networks and molecular mechanisms involved in salamander limb regeneration.
Summary statistics obtained:
- Sequence data:
- Total sequences: 418528
- IDs/Sequences with sequence data: 418528
- IDs/Sequences with Gene Ontology Terms: 0
- IDs/Sequences with Enzyme Code Annotations: 0
- IDs/Sequences with Blast results: 35380
- IDs/Sequences with EggNog results: 81611
- Diff. Expression Data
- Total number of IDs/Sequences: 401541
- Total number of significant diff. exp.: 1064
- Number of matched IDs/Sequences: 37885
- Number of matched significantly diff. exp.: 571
- Diff. exp. analysis type: Pairwise Results
- Reactome stats:
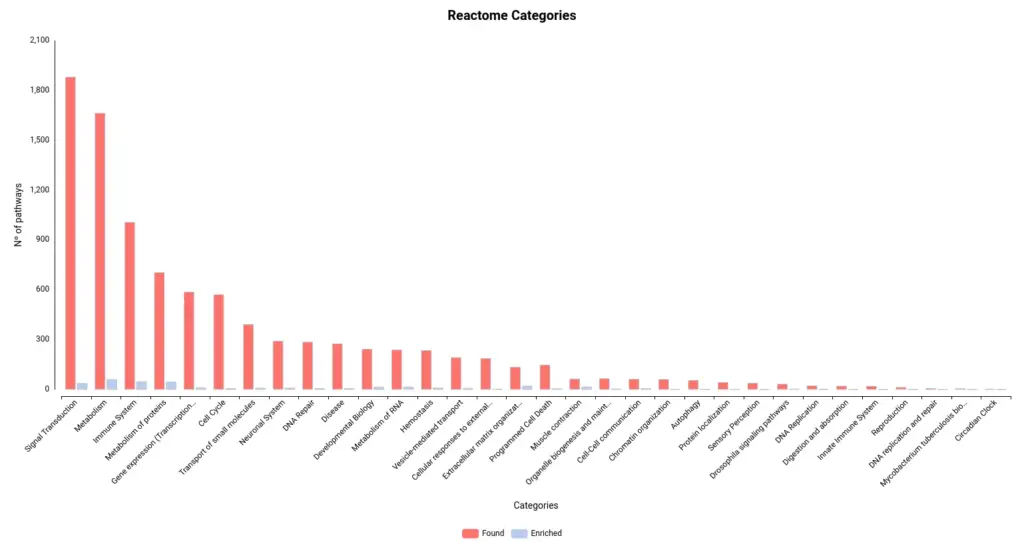
- Found pathways: 9525
- Enriched pathways: 325
- Sequences linked to pathways: 34141
- KEGG stats:
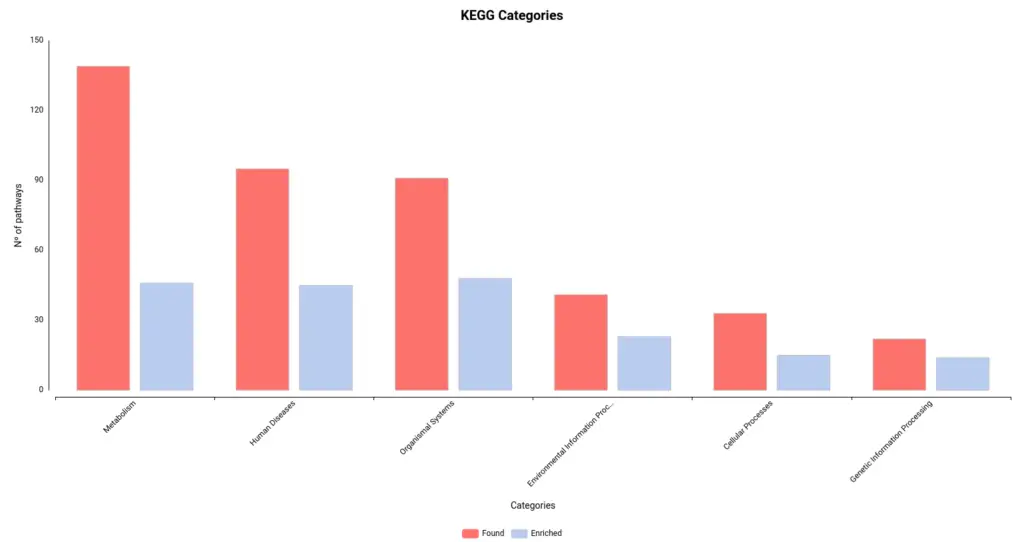
- Found pathways: 421
- Enriched pathways: 184
- Sequences linked to pathways: 18558
Figures 4a and 4b. Number of pathways found and enriched for each category for Reactome (a) and KEGG (b) databases.
Limb regeneration in urodeles is a complex phenomenon involving various fundamental processes, including robust DNA, RNA, and protein synthesis. The immune system also plays a vital role in orchestrating this regenerative process [16]. Our pathway enrichment analyses using GSEA and Fisher’s method align with the formation of a transitional bud blastema, a critical stage in limb regeneration.
In this study, the GSEA analysis revealed several highly enriched pathways from KEGG and Reactome databases. Notably, we observed a significant presence of pathways associated with the immune response, including those related to cancer and other diseases. This finding underscores the importance of immune-related mechanisms in coordinating and supporting the regenerative process. Additionally, we consistently identified pathways linked to muscle activity and cellular machinery, both of which are essential for effective wound repair and tissue regeneration.
he enrichment of immune-related pathways suggests the involvement of immune cells and their molecular interactions in driving the regenerative response. These pathways likely contribute to the clearance of damaged tissue, suppression of inflammation, and activation of regenerative signaling cascades. Furthermore, the identification of pathways associated with muscle activity underscores the significance of muscle regeneration and reorganization during limb regrowth. The activation of pathways involved in cellular machinery points to the dynamic cellular processes underlying tissue repair and remodeling.
Collectively, the pathway analysis results provide valuable insights into the molecular mechanisms underlying limb regeneration in urodeles. The enrichment of immune-related pathways, muscle activity-associated pathways, and pathways associated with cellular machinery highlights the multifaceted nature of limb regeneration and underscores the intricate interplay of various biological processes involved in this remarkable regenerative phenomenon.
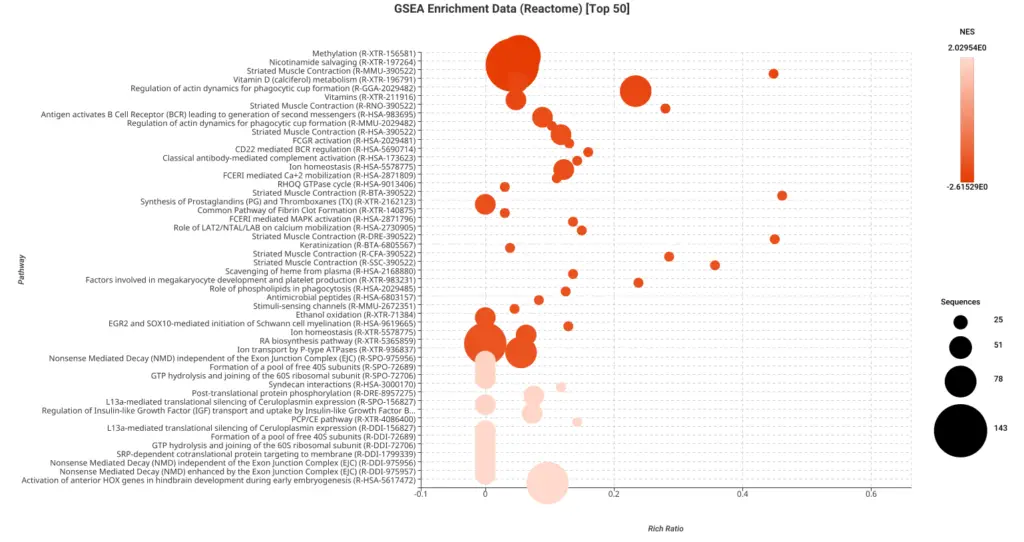
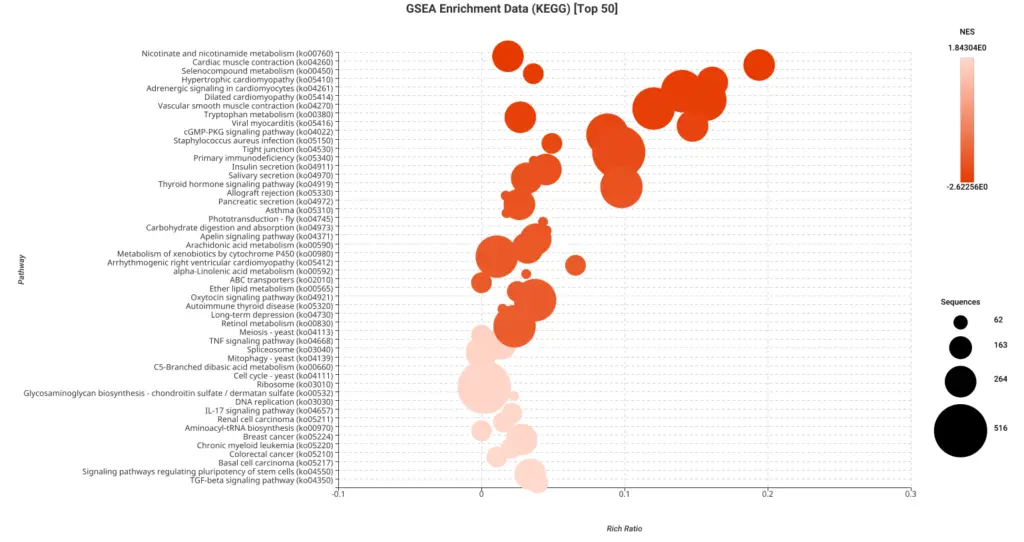
Figures 5a and 5b. Dot plot of the top 50 GSEA enriched pathways sorted by normalized enrichment score (NES) for Reactome (a) and KEGG (b) databases.
Figures 5a and 5b present dot plots illustrating the top 50 enriched pathways identified through GSEA analysis. The pathways are sorted based on the normalized enrichment score (NES) and are specifically derived from the Reactome (a) and KEGG (b) databases.
In these dot plots, each dot represents a pathway, and its size corresponds to the number of sequences matched to that pathway. The color of the dot indicates the NES value, with different shades representing varying degrees of enrichment. The “rich ratio” is depicted as the ratio of differentially expressed sequences to the total number of matched sequences for each pathway.
These visual representations offer a comprehensive overview of the enriched pathways in the Reactome and KEGG databases, allowing for quick identification and assessment of the most significant pathways involved in salamander limb regeneration.
Pathway Enrichment Analysis
Subsequently, we performed pathway enrichment analyses using Fisher’s exact test and Gene Set Enrichment Analysis (GSEA). These analyses were conducted using the pairwise analysis object mentioned earlier, utilizing the default settings provided by the software. The top 10 results per tag are summarized here for reference.
Pathway Diagram Visualization
To further explore the pathway analysis results, pathway diagrams were visualized using OmicsBox. By right-clicking a specific pathway in the pathway table and selecting “Show Pathway Diagram,” researchers can intuitively study the different reactions and interactions within the pathway of interest.
This visual approach becomes particularly valuable when researchers have prior biological knowledge or specific pathways they wish to investigate. Rather than studying the entire results table, focusing on a specific pathway or term allows for more efficient analysis. For example, in the context of salamander regeneration, it is known that the decline in histolysis of the stump is associated with the activity of tissue inhibitors of metalloproteinases (TIMPs).
Even without prior functional annotation of the sequences, launching the pathway analysis with protein linking enabled through Blast/EggNog facilitates searching by gene name. If at least one sequence has been associated with a specific gene, researchers can use the side panel search widget and enter the term “TIMP1.” The auto-suggest option “TIMP1; metalloproteinase inhibitor 1” can be selected, which returns the “HIF-1 signaling pathway” as a relevant pathway associated with TIMP1.
Pathway Diagram Visualization in OmicsBox
By utilizing pathway diagram visualization in OmicsBox, researchers can focus on specific pathways or genes of interest, enabling a deeper understanding of the molecular mechanisms underlying salamander limb regeneration. This interactive approach facilitates targeted exploration and analysis, enhancing the efficiency and effectiveness of the pathway analysis process.
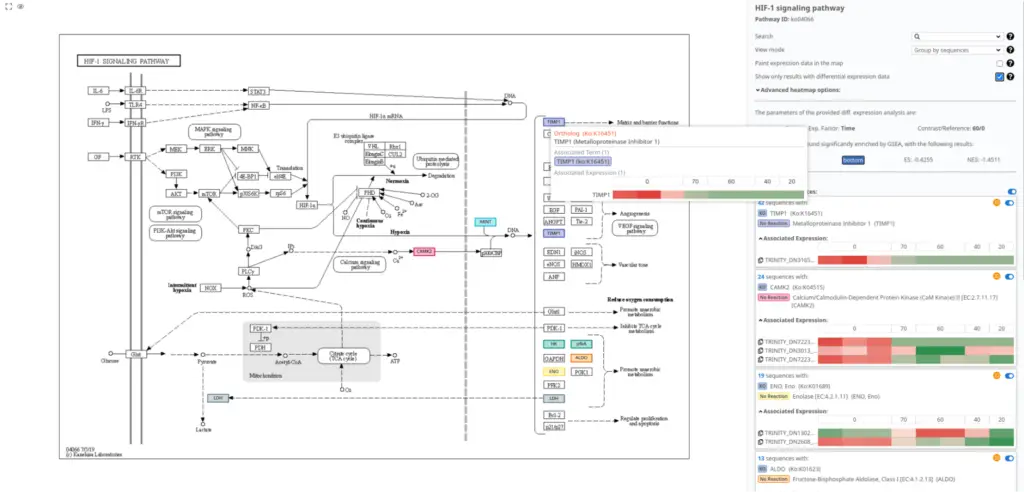
In Figure 6, we present the pathway visualization of the “HIF-1 signaling pathway” using the KEGG diagram. This pathway diagram has been filtered to show the impact of differentially expressed sequences on the pathway.
By examining Figure 6, it can be observed that the expression levels of TIMP1 are higher in the post-amputation time points compared to the control condition. This finding aligns with the expected upregulation of TIMP1 during salamander limb regeneration, particularly during the advanced stages when the levels of matrix metalloproteinases reach their peak [16].
The pathway visualization provides a clear representation of the molecular interactions and relationships within the “HIF-1 signaling pathway.” By focusing on the differentially expressed sequences, we gain insights into the specific gene expression changes that contribute to the modulation of this pathway during salamander limb regeneration.
Figure 6 supports the understanding of the role of TIMP1 in the context of the “HIF-1 signaling pathway” and highlights its involvement in the regulation of matrix metalloproteinase activity during the regenerative process.
Conclusions
In conclusion, this study successfully replicated the original transcriptomics pipeline using OmicsBox, with intentional modifications for contaminant removal using Kraken and without executing a functional annotation. The primary focus of this study was the pathway analysis rather than the differential gene expression analysis. One notable advantage of utilizing OmicsBox was its capability to perform pathway analysis even without prior functional annotation data, making it particularly useful for non-model organisms.
The pathway enrichments obtained through OmicsBox were in line with the expected outcomes of urodele limb regeneration. This suggests that the pathway analysis results accurately captured the underlying biological processes involved in this regenerative phenomenon. The ability of OmicsBox to generate meaningful pathway enrichments without the need for extensive prior annotation data highlights its versatility and utility as a valuable tool for transcriptomics and pathway analysis in non-model organisms.
Overall, this study demonstrates the effectiveness of OmicsBox as a versatile tool in the field of transcriptomics, enabling researchers to gain insights into the molecular mechanisms underlying complex biological processes, such as limb regeneration in non-model organisms. By leveraging the capabilities of OmicsBox, researchers can uncover key pathways and biological processes driving regeneration, contributing to a deeper understanding of regenerative biology in diverse organisms.
References
- Gotz S., Garcia-Gomez JM., Terol J., Williams TD., Nagaraj SH., Nueda MJ., Robles M., Talon M., Dopazo J. and Conesa A. (2008). High-throughput functional annotation and data mining with the Blast2GO suite. Nucleic acids research, 36(10), 3420-35.
- Arenas Gómez, C.M., Woodcock, R.M., Smith, J.J. et al. Using transcriptomics to enable a plethodontid salamander (Bolitoglossa ramosi) for limb regeneration research. BMC Genomics 19, 704 (2018). https://doi.org/10.1186/s12864-018-5076-0
- OmicsBox – Bioinformatics Made Easy, BioBam Bioinformatics, March 3, 2019, https://www.biobam.com/omicsbox
- Andrews, S. (2010). FastQC: A Quality Control Tool for High Throughput Sequence Data [Online]. Available online at: http://www.bioinformatics.babraham.ac.uk/projects/fastqc/
- Grabherr MG, Haas BJ, Yassour M, Levin JZ, Thompson DA, Amit I, Adiconis X, Fan L, Raychowdhury R, Zeng Q, Chen Z, Mauceli E, Hacohen N, Gnirke A, Rhind N, di Palma F, Birren BW, Nusbaum C, Lindblad-Toh K, Friedman N, Regev A (2011). “Full-length transcriptome assembly from RNA-Seq data without a reference genome.” Nature Biotechnology, 29(7):644-52
- Li W. and Godzik A. (2006). Cd-hit: a fast program for clustering and comparing large sets of protein or nucleotide sequences. Bioinformatics (Oxford, England), 22(13), 1658-9.
- Wood DE, Salzberg SL: Kraken: ultrafast metagenomic sequence classification using exact alignments.Genome Biology 2014, 15:R46
- Wood DE., Lu J. and Langmead B. (2019). Improved metagenomic analysis with Kraken 2. Genome biology, 20(1), 257
- Langmead B. and Salzberg SL. (2012). Fast gapped-read alignment with Bowtie 2. Nature methods, 9(4), 357-9
- Li B and Dewey CN (2011). “RSEM: accurate transcript quantification from RNA-Seq data with or without a reference genome.” BMC Bioinformatics, 12:323
- Robinson MD, McCarthy DJ and Smyth GK (2010). “edgeR: a Bioconductor package for differential expression analysis of digital gene expression data.” Bioinformatics, 26, pp. -1
- Altschul, S.F., Gish, W., Miller, W., Myers, E.W. & Lipman, D.J. (1990) “Basic local alignment search tool.” J. Mol. Biol. 215:403-410
- Jaime Huerta-Cepas, Damian Szklarczyk, Davide Heller, Ana Hernández-Plaza, Sofia K Forslund, Helen Cook, Daniel R Mende, Ivica Letunic, Thomas Rattei, Lars J Jensen, Christian von Mering, Peer Bork, eggNOG 5.0: a hierarchical, functionally and phylogenetically annotated orthology resource based on 5090 organisms and 2502 viruses, Nucleic Acids Research, Volume 47, Issue D1, 08 January 2019, Pages D309–D314, https://doi.org/10.1093/nar/gky1085
- Fisher, R.A. (1992). Statistical Methods for Research Workers. In: Kotz, S., Johnson, N.L. (eds) Breakthroughs in Statistics. Springer Series in Statistics. Springer, New York, NY. https://doi.org/10.1007/978-1-4612-4380-9_6
- Subramanian, A., Tamayo, P., Mootha, V. K., Mukherjee, S., Ebert, B. L., Gillette, M. A., Paulovich, A., Pomeroy, S. L., Golub, T. R., Lander, E. S., and Mesirov, J. P. (2005). Gene set enrichment analysis: A knowledge-based approach for interpreting genome-wide expression profiles. Proceedings of the National Academy of Sciences, 102(43):15545– 15550
- Stocum DL. Mechanisms of urodele limb regeneration. Regeneration (Oxf). 2017 Dec 26;4(4):159-200. doi: 10.1002/reg2.92. PMID: 29299322; PMCID: PMC5743758.
 Carlos Martínez
Carlos's expertise lies in the areas of pathway analysis and the development of advanced visualization tools, which is supported by his academic background in both biology and technology.
He holds a BSc in Biotechnology and an MSc in Omics Data Analysis, among other qualifications.