1. Introduction
Juvenile rhesus macaques commonly suffer from idiopathic chronic diarrhea (ICD). This disease is characterized by inflammation of the colon and repeated bouts of diarrhea. It is a common cause of morbidity and mortality among macaques because it is unresponsive to drugs. The gut microbiome of macaques with ICD is characterized by abrupt changes when compared to healthy individuals. However, no single pathogen has been identified as responsible for the disease yet.
In this study we will re-analyze the metatranscriptomics dataset of the study that was originally published by Westreich et. al. in 2019 (doi: https://doi.org/10.1186/s40168-019-0664-z) [1].
2. Objectives
The main objectives of this metatranscriptomics study are:
- To understand the differences in microbiome composition between healthy macaques and macaques with ICD.
- To functionally characterize the gut microbiome of macaques with ICD.
- To use the Metagenomics and Transcriptomics modules in OmicsBox [2] to develop a complete metatranscriptomics study.
3. Data collection and preprocessing
The data was downloaded from SRA (NCBI). Four macaques each, with six biological replicates were initially considered for this study.
| Macaque | Condition | SRA runs | Number of reads |
| Macaque 2 | ICD | SRR6425414-SRR6425419 | 190M |
| Macaque 3 | ICD | SRR6425420-SRR6425425 | 220M |
| Macaque 23 | Healthy | SRR6425402-SRR6425407 | 210M |
| Macaque 24 | Healthy | SRR6425408-SRR6425413 | 190M |
After downloading the FastQ files, preprocessing was performed in OmicsBox (General Tools > FastQ Tools > FastQ Preprocessing) [3]. We removed Illumina adapters and filtered the reads by quality with default parameters.
A quality assessment step was performed in order to check the quality of the final reads (General Tools > FastQ Tools > FastQ Quality Check) [4]. The overall sequence quality of the dataset was very good and only a little number of reads had to be removed from the pool (about 5M in each sample). Illumina adapters were present in, at least, the 2-3% of reads in each sample and successfully removed.
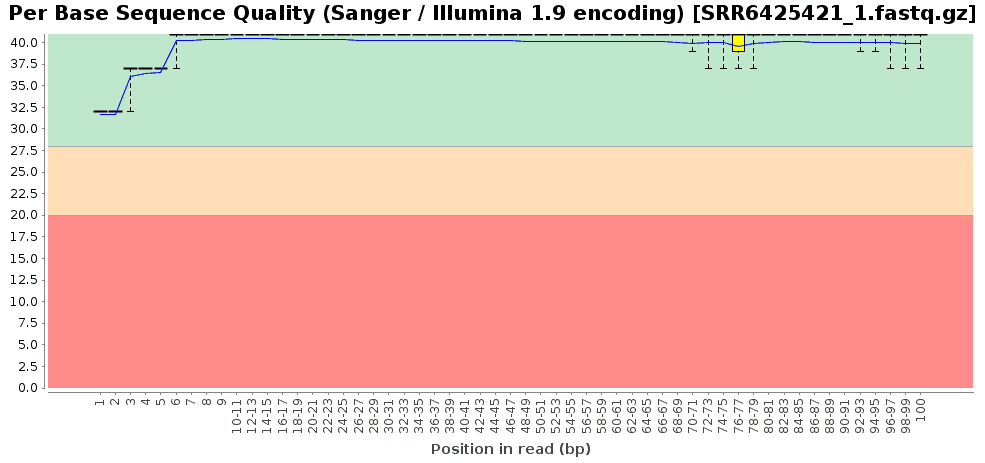
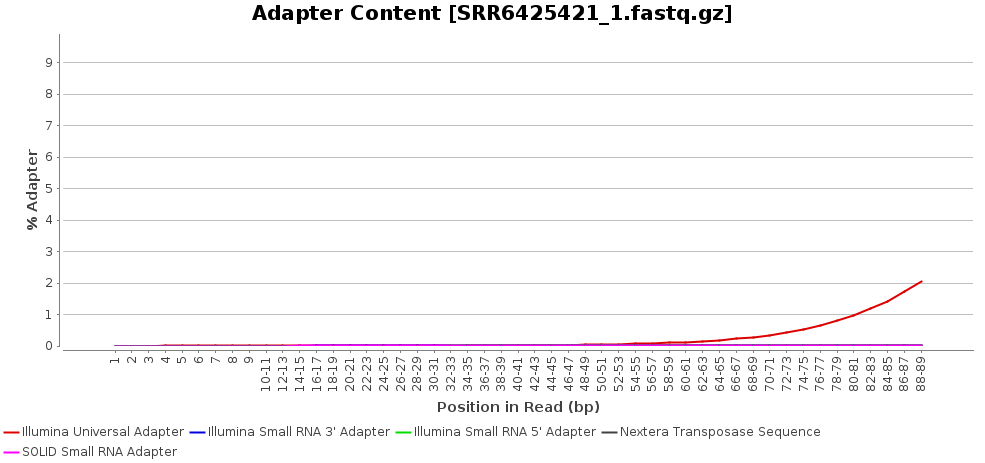
Figures 1a and 1b. Exemplary fastq quality check results for the accession SRR6425421. Per base sequence quality (a) and adapter content of the raw fastq (b).
4. Taxonomic Classification
The taxonomic classification was carried out in OmicsBox using the preprocessed reads as input (Metagenomics > Taxonomic Classification > Kraken2) [6, 7, 8]. Big differences were found between conditions (between healthy and sick macaques), which can be easily visualized in the graph below:
Figure 2. Taxonomic Classification bar chart for 4 macaques (6 technical replicates).
Prevotella is significantly overrepresented in macaques with ICD. This group of bacteria is considered to be a marker of increased availability of carbohydrates, which can be related to ICD. In addition, Bacteroides is also overrepresented in these individuals which can also be related to the illness.
Furthermore, it seems clear that microbial diversity is reduced when macaques develop ICD. The bar chart shows this and the diversity indexes from the OmicsBox report confirm the hypothesis: Shannon indexes for healthy individuals vary between 0.66 and 0.68, while indexes for macaques with ICD are in the range 0.42 – 0.57. A higher Shannon index indicates higher microbial diversity, which can be considered a sign of a more stable microbiome.
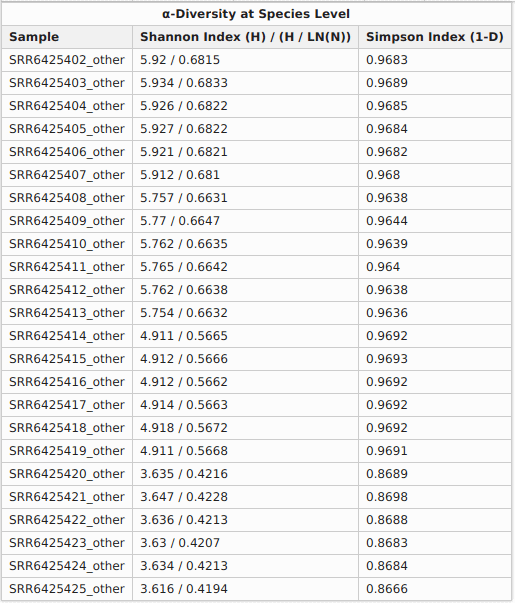
The PCoA plot verifies that macaques with ICD separate clearly from healthy individuals. In addition, the rarefaction curves show that the sequencing depth was sufficient to capture the microbial diversity in each sample.
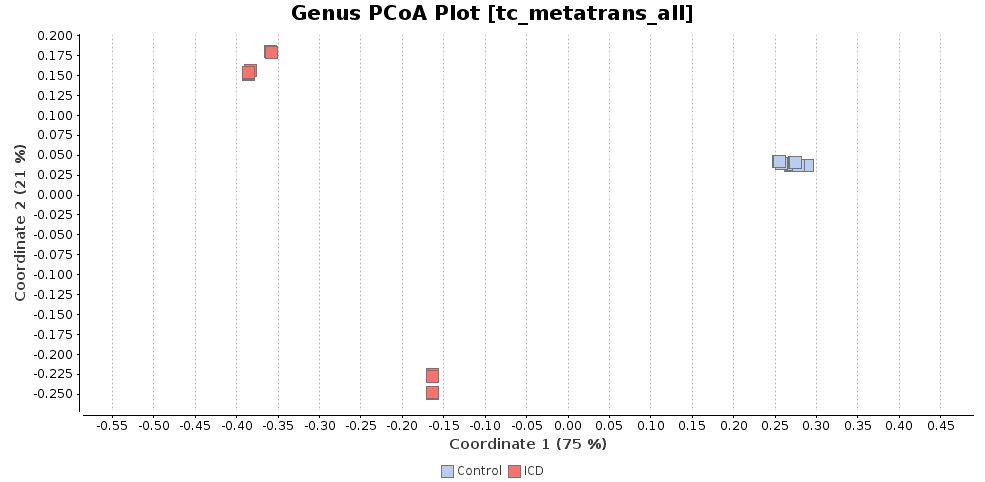
Figures 3a, 3b and 3c. Diversity indexes, PCoA plot, and rarefaction curves.
5. rRNA removal
Biological metatranscriptomics samples usually contain large amounts of ribosomal rRNA (>90% of reads in some cases). The excess of rRNA is considered noise and does not contribute towards most downstream analyses, such as finding differentially expressed genes or pathway characterization. Most of the rRNA is removed physically, but up to 15% remain In silico and have to be removed with bioinformatics tools. We used SortMeRNA (Metagenomics > Metatranscriptomics Tools > rRNA Removal) [5] because it is recommended in the literature. In this dataset, the fraction of rRNA represented 6-8% of the total number of reads and was therefore removed.
For functional characterization (assembly, functional annotation, and enrichment analysis), only the isolated mRNA was used.
6. Metatranscriptome Assembly
The assembly of a reference metatranscriptome was carried out with Trinity (Transcriptomics > RNA-Seq Assembly > RNA-Seq De Novo Assembly) [9] and MEGAHIT (Metagenomics > Metagenomic Assembly > MEGAHIT) [10], both using default parameters. The assemblies were then analyzed with QUAST [11]. Both assemblers, Trinity, and MEGAHIT are widely used for transcriptomics and metagenomics studies, respectively, but there is no standard for metatranscriptomics studies yet.
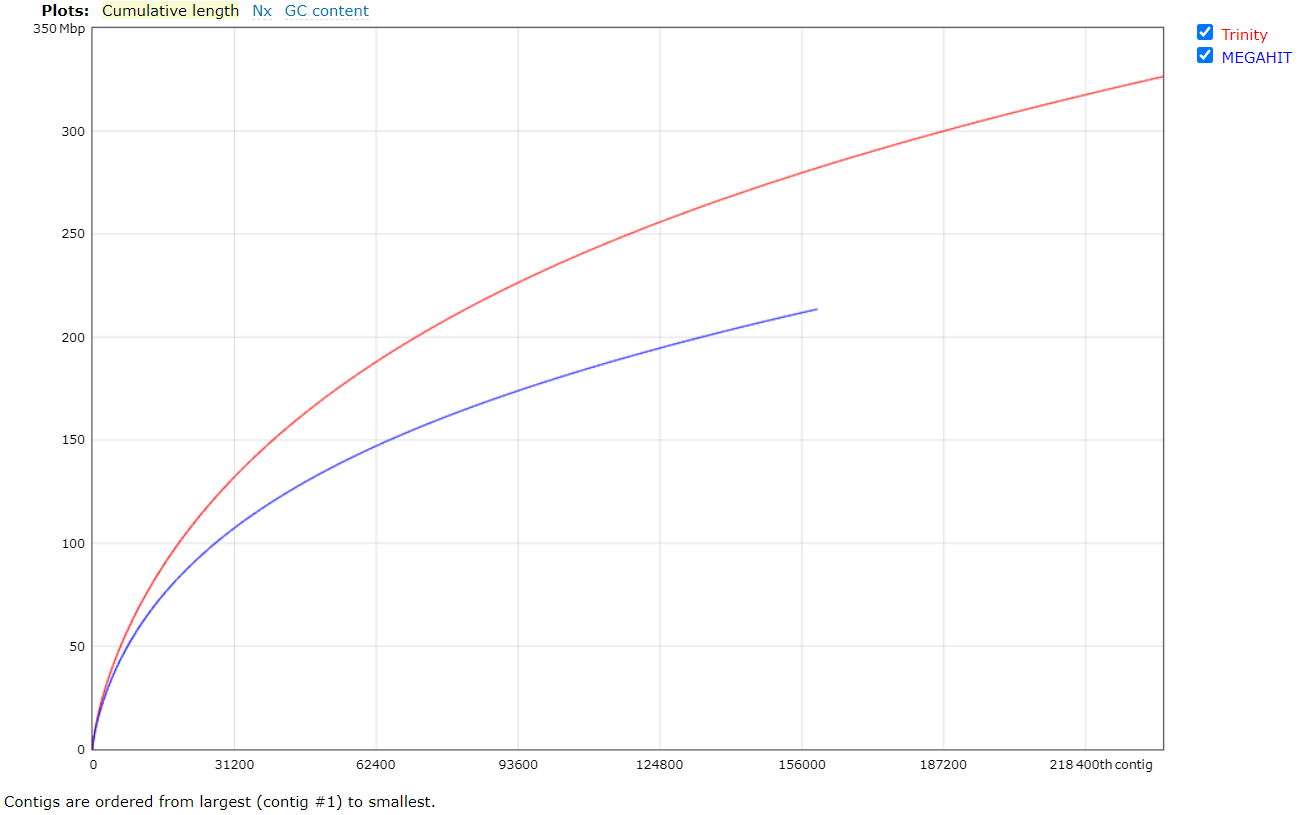
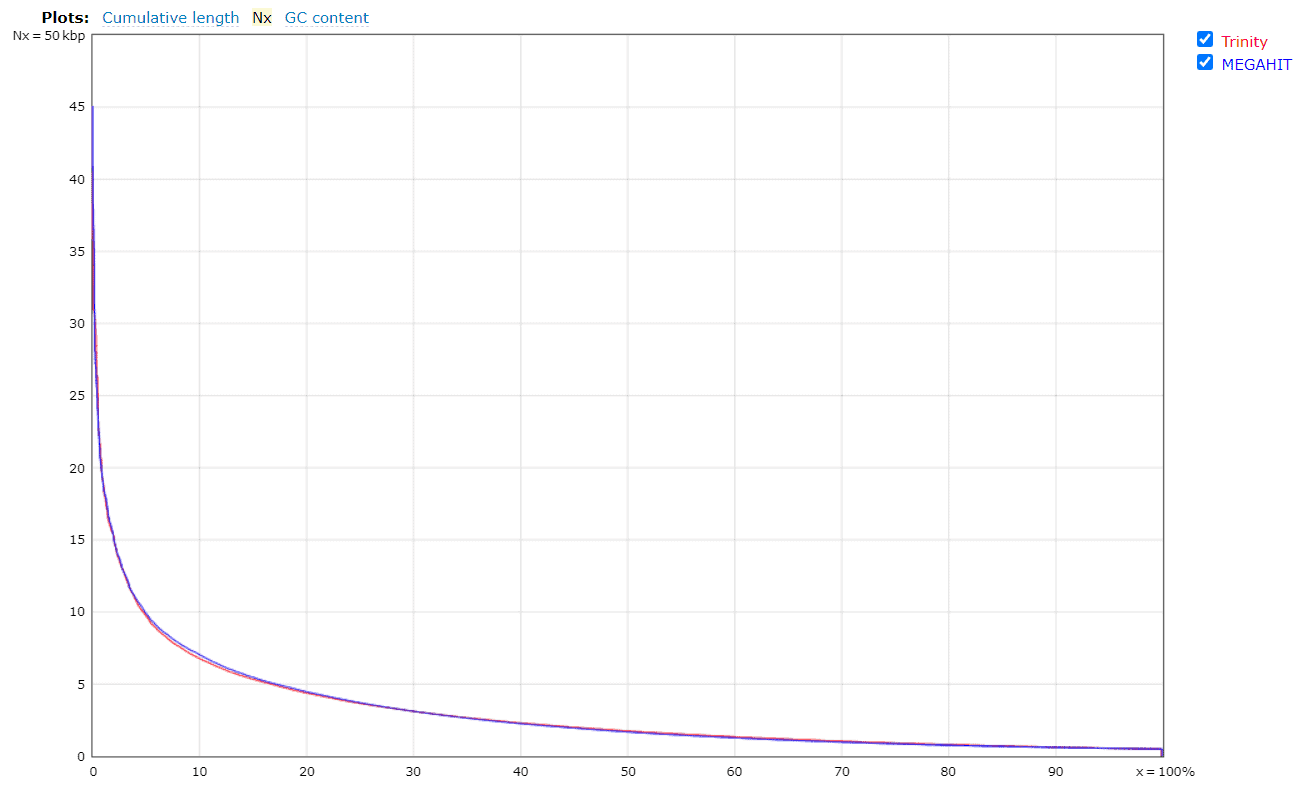
Figures 4a and 4b. Quality assessment for the metatranscriptomes generated by Trinity and MEGAHIT.
In general, Trinity provides better results than MEGAHIT, but it was computationally more expensive and time-consuming (6 days runtime). The QUAST report reveals that MEGAHIT performed well enough (6 hours runtime). Thus, the assembly generated by MEGAHIT with 2.2M transcripts was kept for further analysis.
7. Functional annotation
The functional annotation was carried out using DIAMOND [12], instead of Blast, and following the Blast2GO methodology. 808,811 transcripts could be annotated (36.4% of the total amount of transcripts).
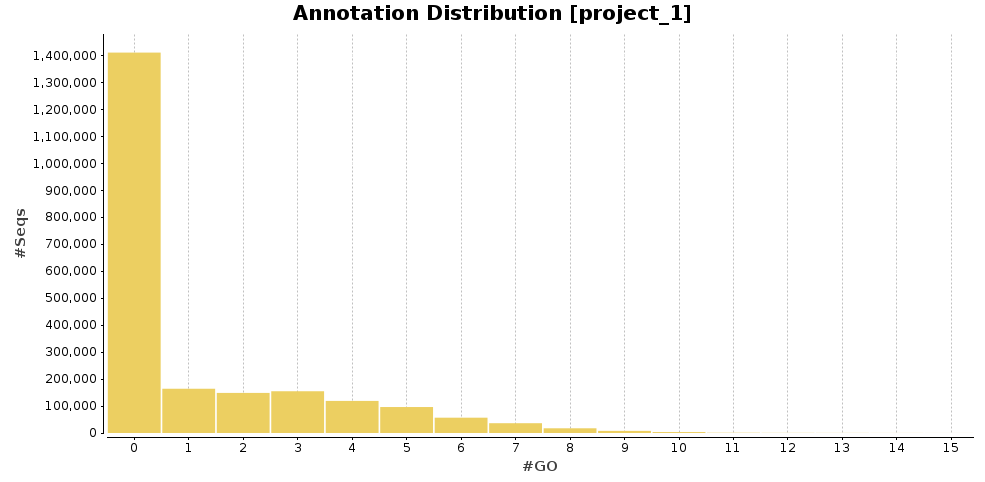
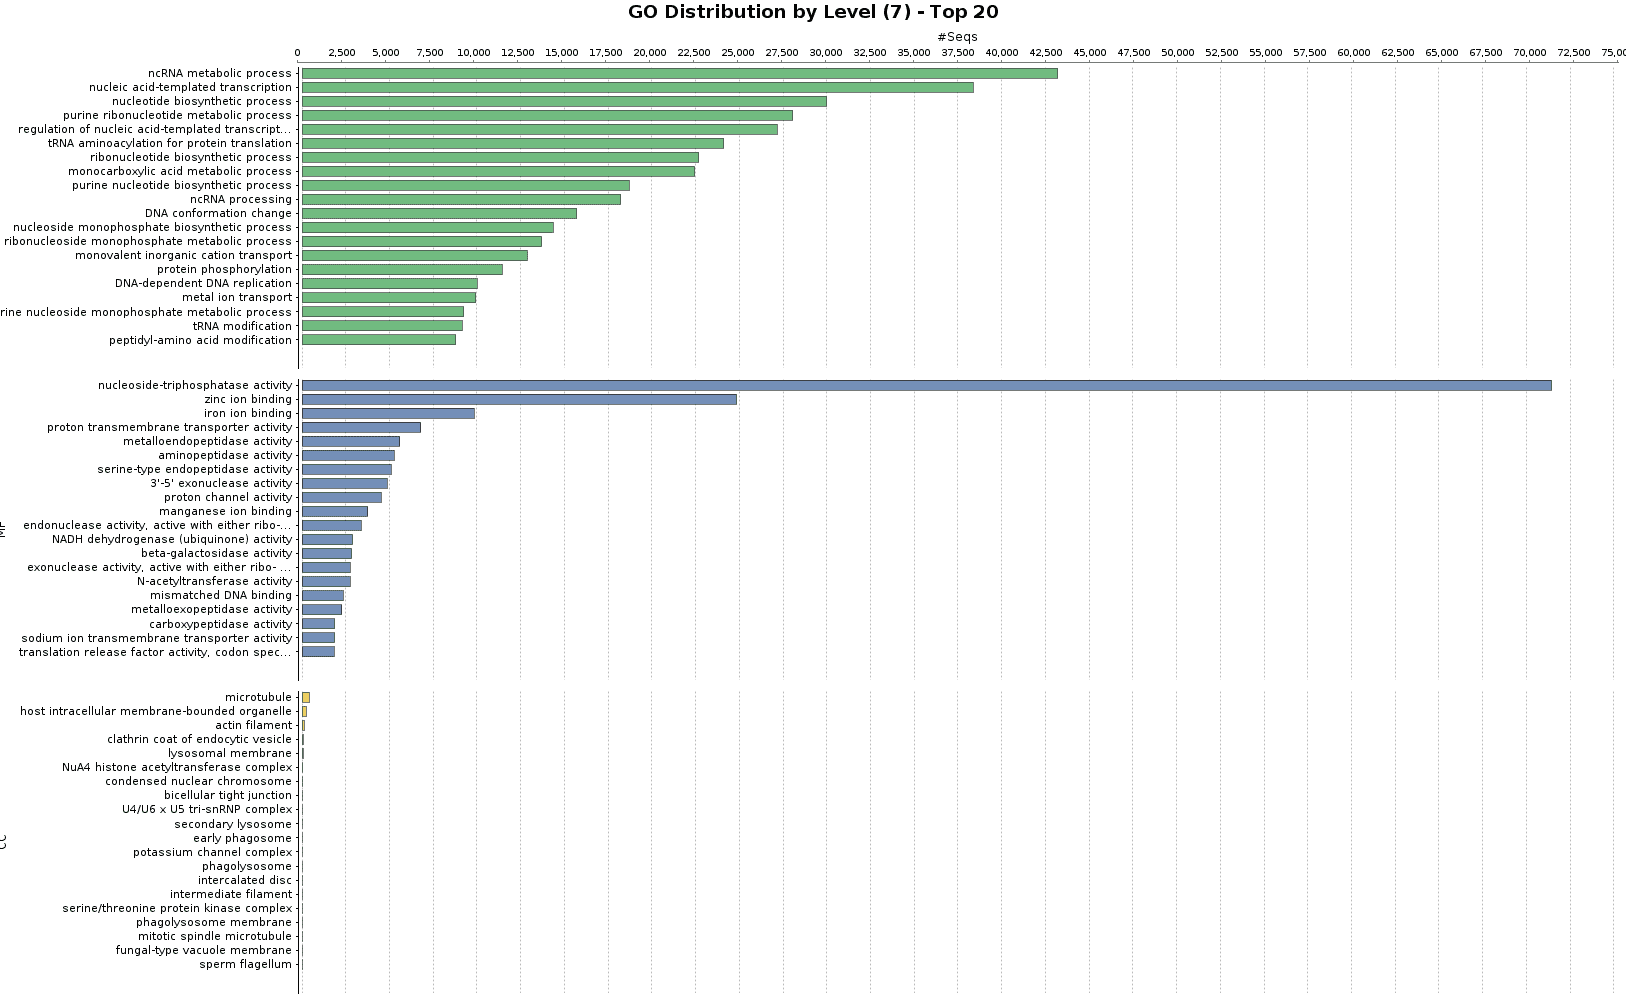
Figures 5a and 5b. GO Annotation distribution and GO distribution at level 7.
8. Quantification, differential expression analysis and enrichment analysis
Once the reference metatranscriptome was assembled and annotated, the transcriptomics tools included in OmicsBox were used to quantify the expression level of each transcript and to perform the differential expression analysis. Firstly, the count table was generated (Transcriptomics > Create Count Table > Transcript-level Quantification) [8, 13].
Then, a differential expression analysis between the two conditions (Transcriptomics > Run Differential Expression Analysis > Pairwise Differential Expression Analysis) was performed [14]. The thresholds for considering a gene as differentially expressed were set as follows: FDR < 0.01 and LogFC > 2 or LogFC < -2. With these settings, 113,198 genes are differentially expressed: 60,566 are up-regulated within samples of sick macaques, while 52,632 are considered down-regulated. This means that 5.1% of the transcripts generated with MEGAHIT are differentially expressed, they are represented in the figure below according to their LogFC and FDR:
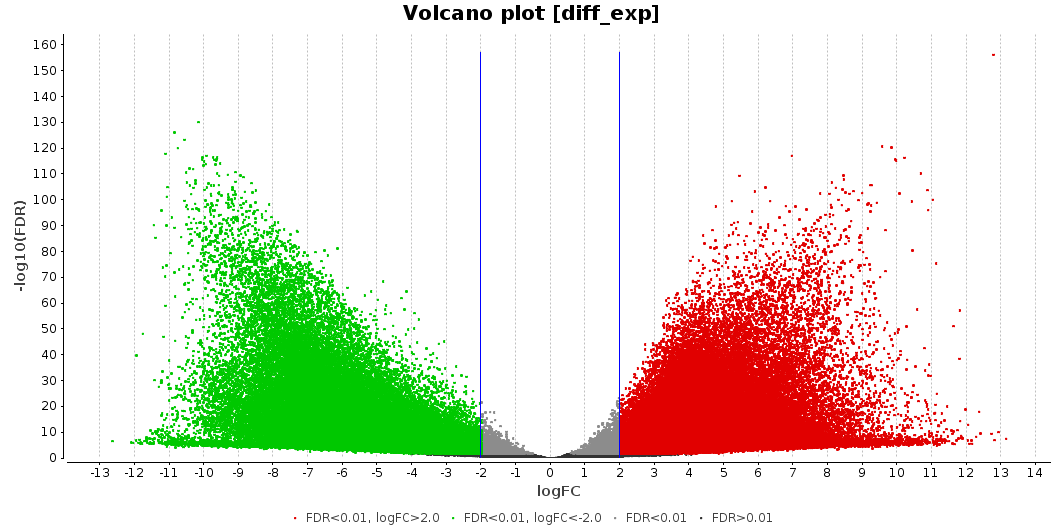
Figure 6. Volcano plot.
Finally, a Gene Set Enrichment Analysis of GO terms (Functional Analysis > Enrichment Analysis > Gene Set Enrichment Analysis) was performed with the functional annotation obtained in section 7 [15]. The FDR threshold for considering a GO term as enriched or depleted was set to 0.05, and the less specific GO terms were removed from the GSEA results. The remaining parameters were set as default.
61 GO terms were detected as depleted (bottom tag) and 115 as enriched (top tag).
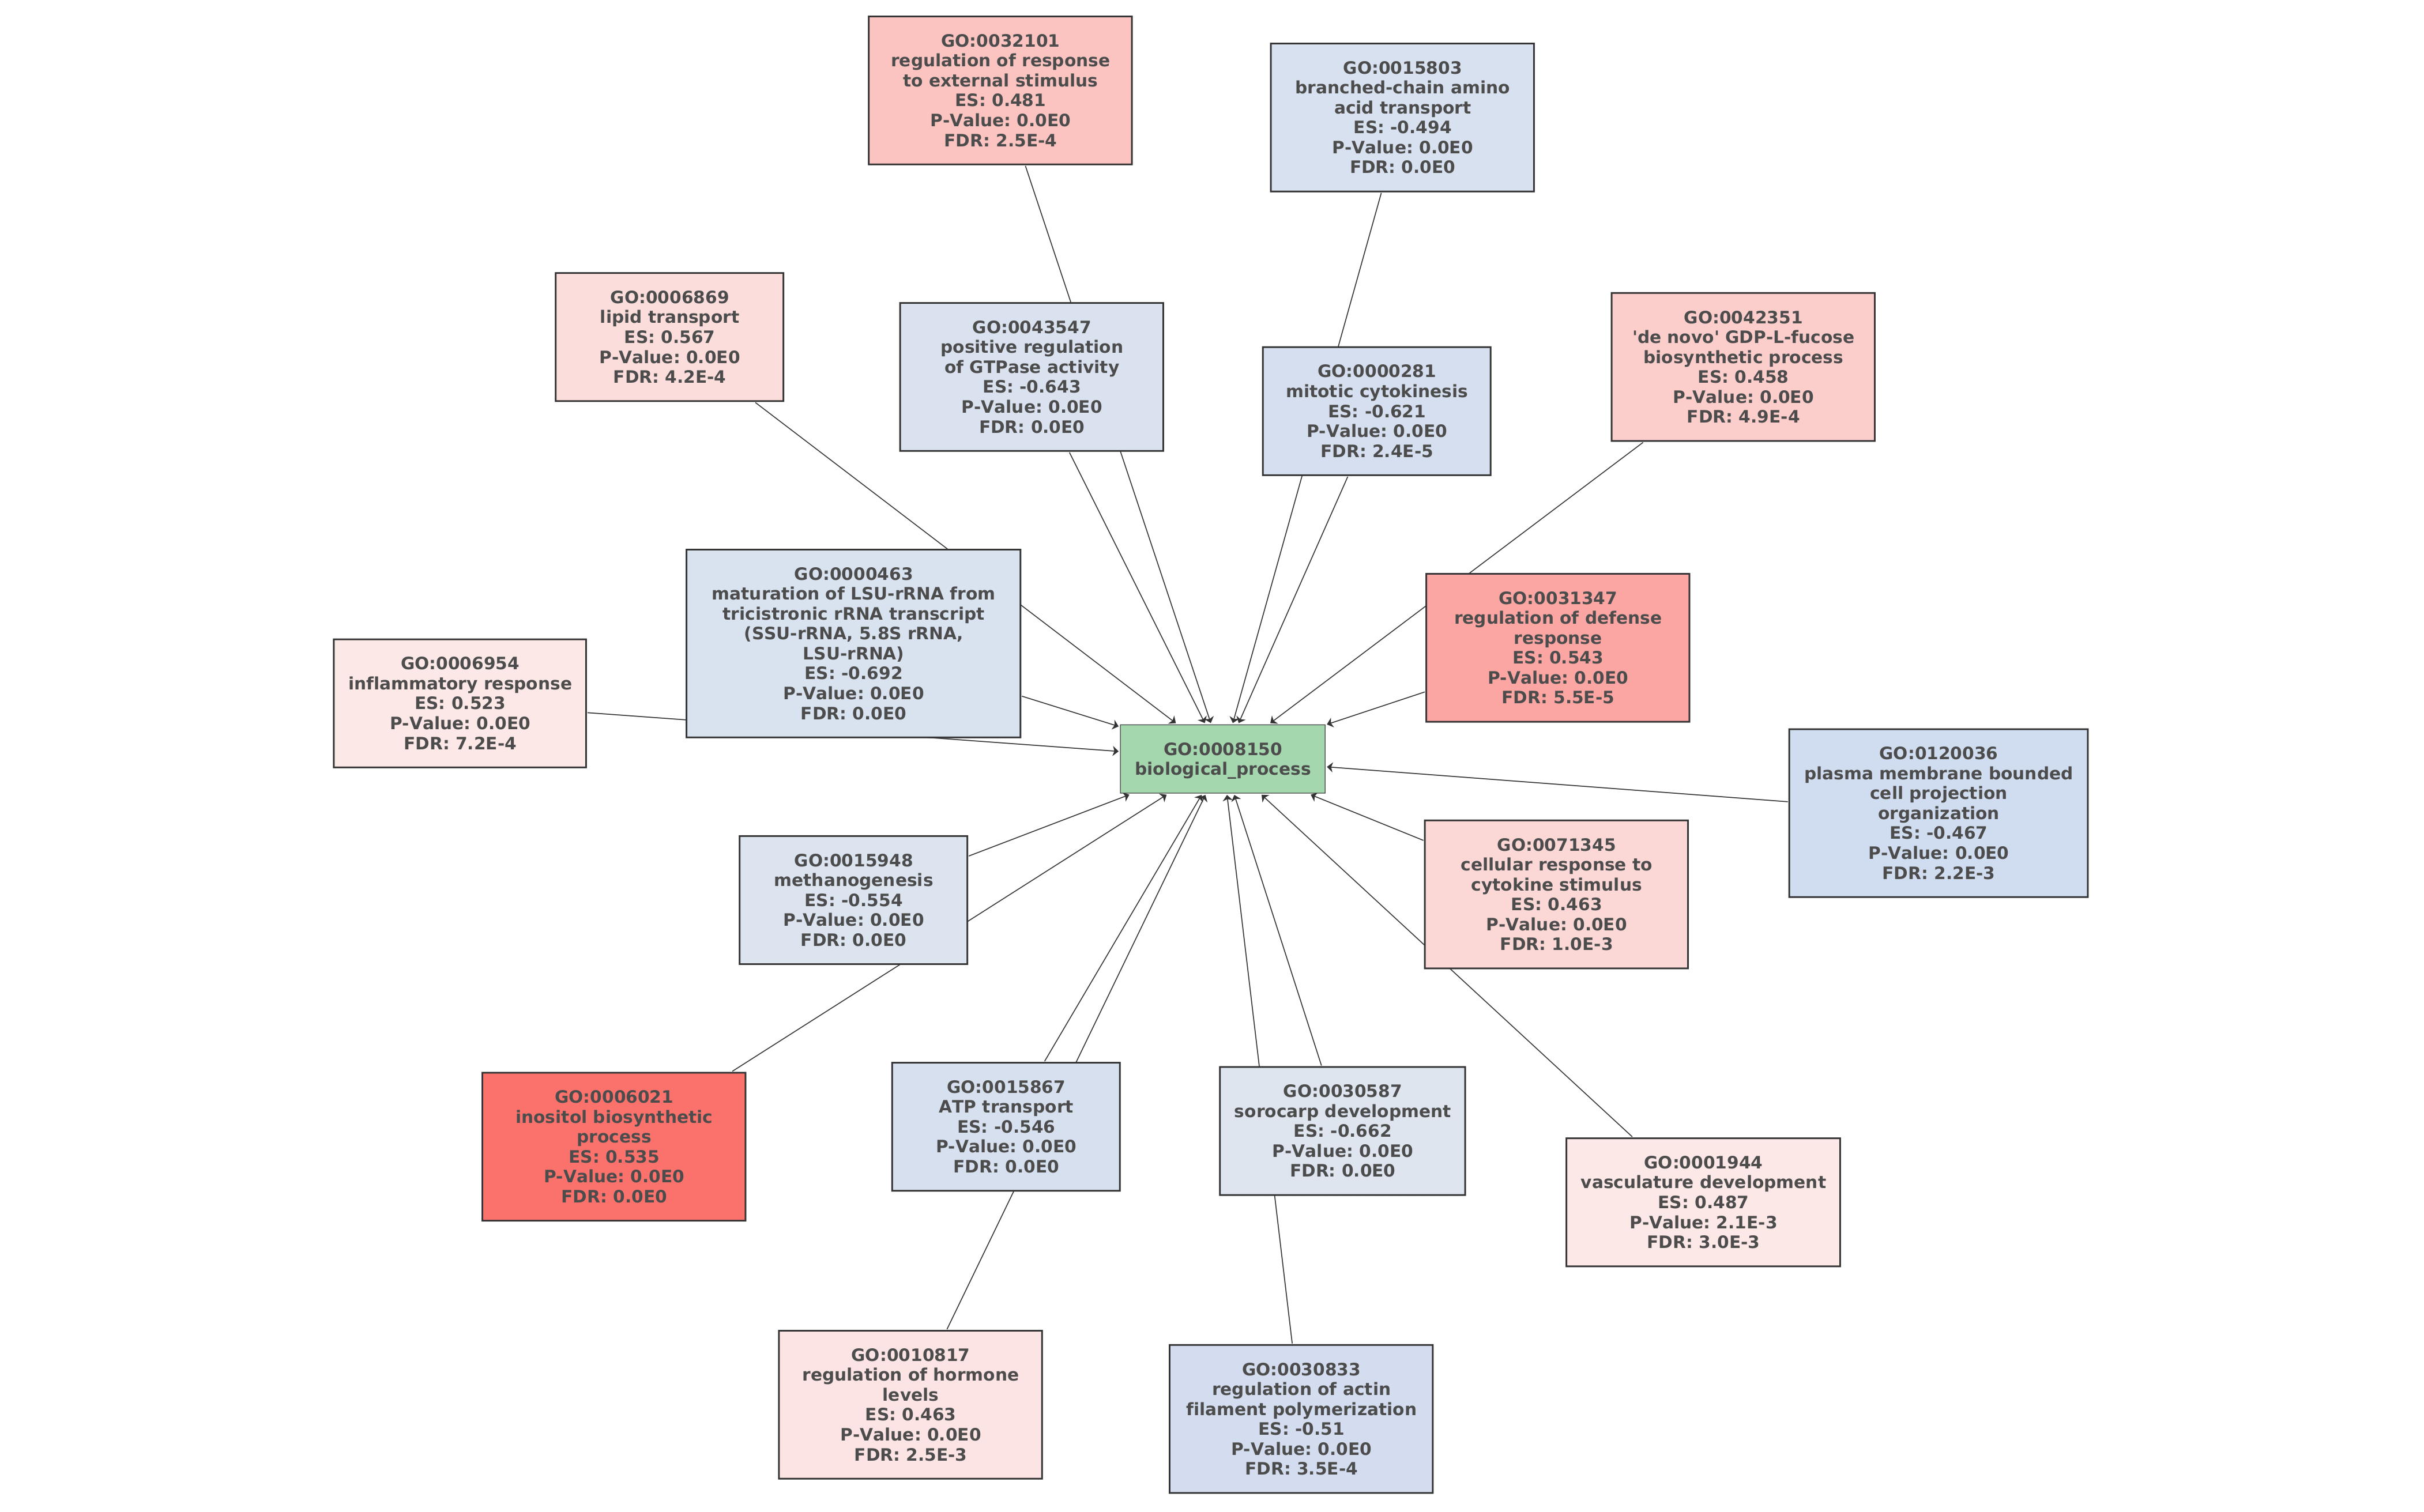
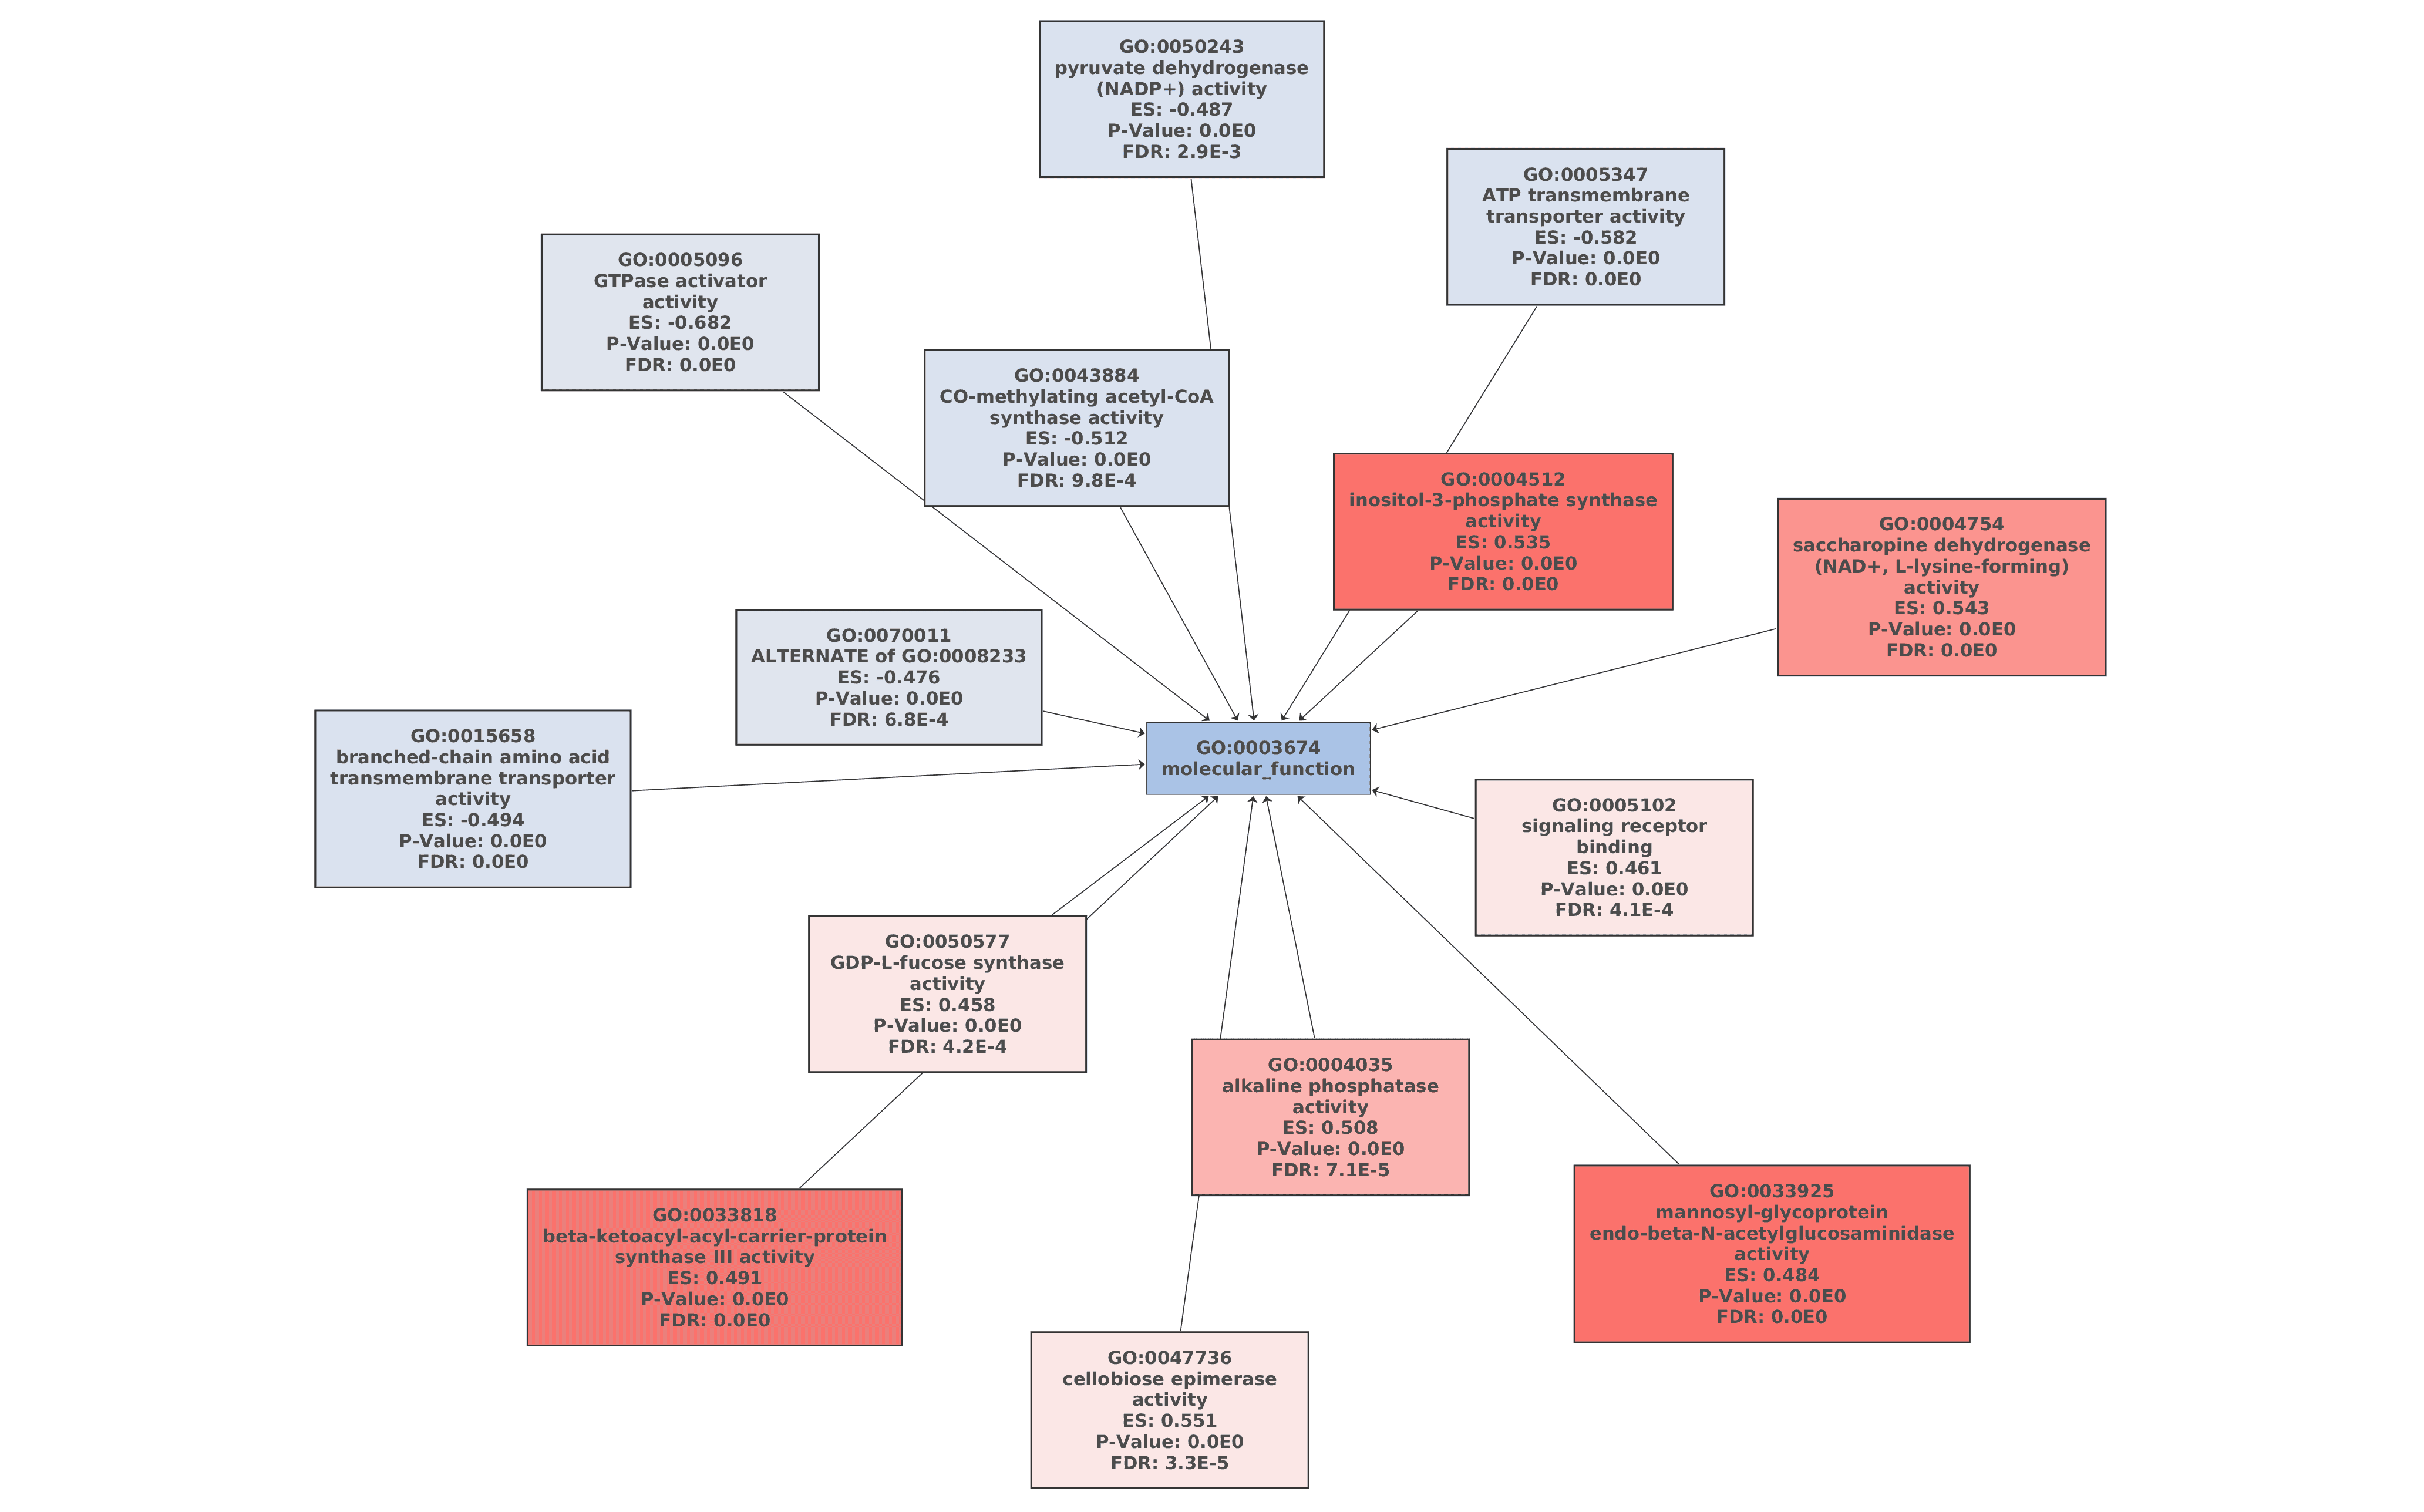
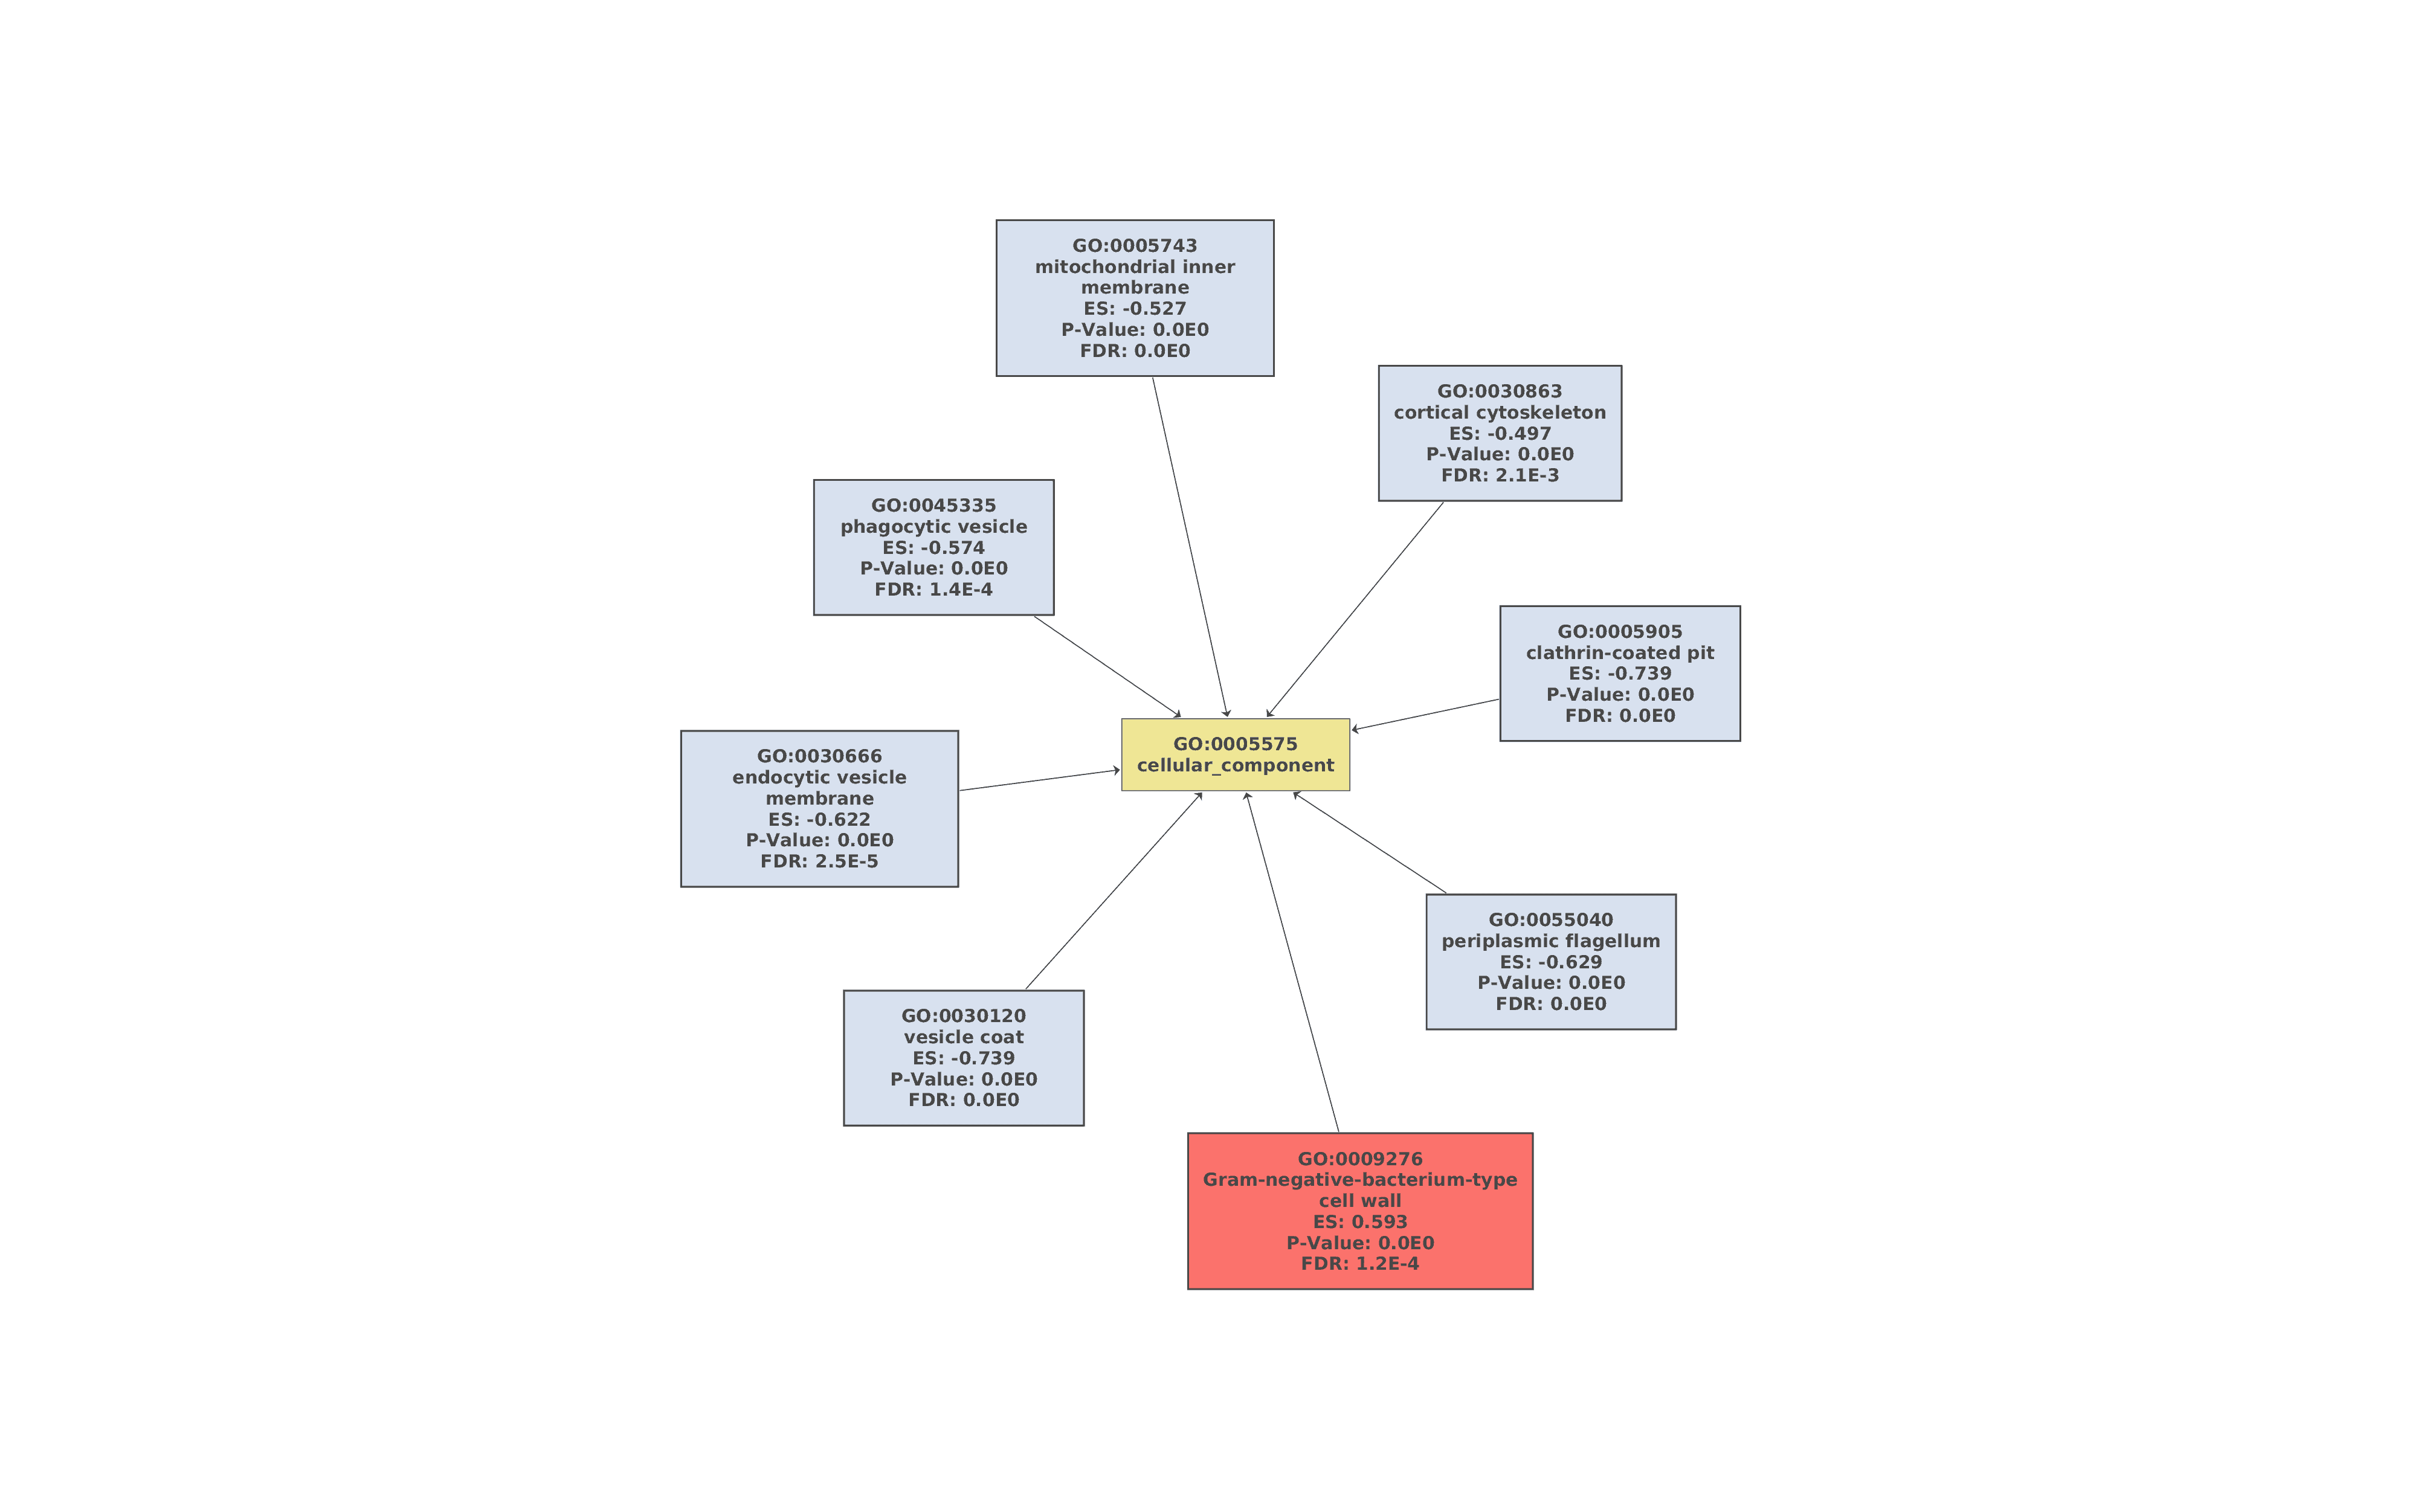
Figures 7a, 7b, and 7c. GO Graphs with the results of GSEA. GO terms highlighted in RED are “overrepresented” among macaques with ICD, while “underrepresented” GO terms are colored in BLUE. Color intensities vary according to their Normalized Enrichment Score (NES).
9. Discussion
Idiopathic chronic diarrhea (ICD) is characterized by chronic inflammation of the colon and is highly related to the composition of the gut microbiome in rhesus macaques. Cellular responses of the gut epithelium cells to this inflammation can be the origin of the development of symptoms. GO terms like “inflammatory response”, “regulation of defense response” or “cellular response to cytokine stimulus” may indicate that there is an important immunologic process associated with this disease.
The inflammation and the disease may be triggered by two different mechanisms related to mucin degradation. Mucins are a family of glycosylated proteins produced by the gut epithelial tissue. These mucins have the special ability to produce gels, serving functions from lubrication to cell signaling to forming chemical barriers. The chemical compositions of mucins are oligosaccharides formed by galactose, glucose, fucose, and N-acetylglucosamine or N-acetylneuraminic acid.
The molecular functions “N-acetylglucosaminidase”, “GDP-L-fucose synthase activity” or “saccharopine dehydrogenase” that resulted overrepresented in the GSEA are examples of saccharide metabolism and mucin-degrading enzymes, which can be the main cause of the inflammation.
Finally, further investigation of the transcripts related to fucose metabolism revealed that the genus Prevotella was the main responsible for the overexpression of this gene. This group of bacteria can be acting as an opportunist and is probably responsible for developing the disease, although it seems that ICD is a multifactorial disease and a much greater number of bacteria are involved in developing ICD.
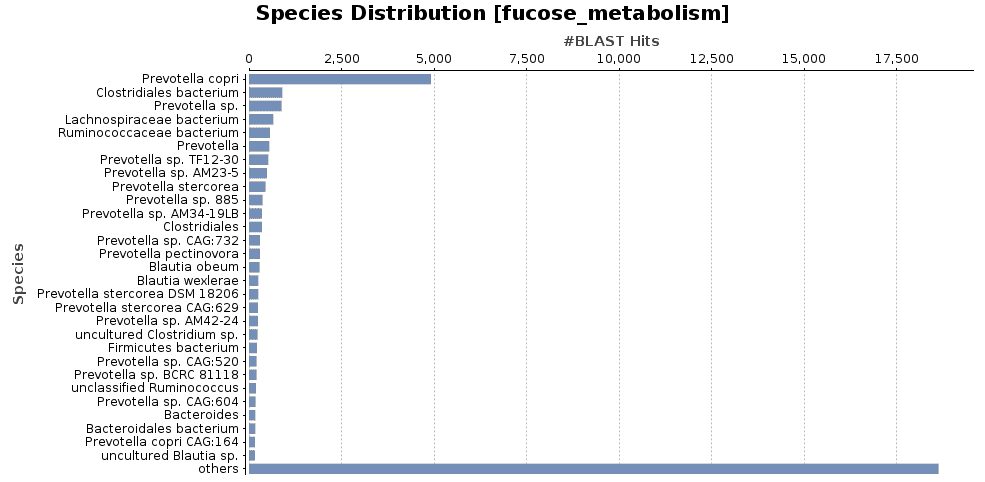
Figure 8. Species distribution of fucose metabolism functions.
10. Conclusions
- The metatranscriptomics analysis with OmicsBox allowed us to identify the taxonomic and functional composition of the microbial communities in the macaques gut.
- A classical transcriptomics approach, combined with a metagenomic approach to taxonomically characterize the sample results in a good approach to analyse metatranscriptomics datasets.
- The microbial diversity is reduced in individuals with ICD when comparing them to healthy individuals, being especially important the misregulation of the abundances of Prevotella and Bacteroides.
- Fucose metabolism and mucin degradation seems to be the responsible of the development of ICD in macaques. This kind of metabolic functions are mainly carried out by Prevotella and Bacteroides.
References
- Westreich, S.T., Ardeshir, A., Alkan, Z. et al. Fecal metatranscriptomics of macaques with idiopathic chronic diarrhea reveals altered mucin degradation and fucose utilization. Microbiome 7, 41 (2019). https://doi.org/10.1186/s40168-019-0664-z
- OmicsBox – Bioinformatics Made Easy, BioBam Bioinformatics, March 3, 2019, https://www.biobam.com/omicsbox
- Bolger, A. M., Lohse, M., & Usadel, B. (2014). Trimmomatic: A flexible trimmer for Illumina Sequence Data
- Andrews, S. (2010). FastQC: A Quality Control Tool for High Throughput Sequence Data [Online]. Available online at: http://www.bioinformatics.babraham.ac.uk/projects/fastqc/
- Evguenia Kopylova, Laurent Noé, Hélène Touzet, SortMeRNA: fast and accurate filtering of ribosomal RNAs in metatranscriptomic data, Bioinformatics, Volume 28, Issue 24, December 2012, Pages 3211–3217, https://doi.org/10.1093/bioinformatics/bts611
- Wood DE, Salzberg SL: Kraken: ultrafast metagenomic sequence classification using exact alignments.Genome Biology 2014, 15:R46
- Wood DE., Lu J. and Langmead B. (2019). Improved metagenomic analysis with Kraken 2. Genome biology, 20(1), 257
- Langmead B. and Salzberg SL. (2012). Fast gapped-read alignment with Bowtie 2. Nature methods, 9(4), 357-9
- Grabherr MG, Haas BJ, Yassour M, Levin JZ, Thompson DA, Amit I, Adiconis X, Fan L, Raychowdhury R, Zeng Q, Chen Z, Mauceli E, Hacohen N, Gnirke A, Rhind N, di Palma F, Birren BW, Nusbaum C, Lindblad-Toh K, Friedman N, Regev A (2011). “Full-length transcriptome assembly from RNA-Seq data without a reference genome.” Nature Biotechnology, 29(7):644-52
- Li D, Liu C-M, Luo R, Sadakane K, Lam T-W. (2015). MEGAHIT: An ultra-fast single-node solution for large and complex metagenomics assembly via succinct de Bruijn graph. Bioinformatics. 31(10), 1674–1676
- Alexey Gurevich, Vladislav Saveliev, Nikolay Vyahhi, Glenn Tesler, QUAST: quality assessment tool for genome assemblies, Bioinformatics, Volume 29, Issue 8, 15 April 2013, Pages 1072–1075, https://doi.org/10.1093/bioinformatics/btt086
- Benjamin Buchfink, Chao Xie & Daniel H. Huson, Fast and Sensitive Protein Alignment using DIAMOND, Nature Methods, 12, 59–60 (2015) doi:10.1038/nmeth.3176.
- Li B and Dewey CN (2011). “RSEM: accurate transcript quantification from RNA-Seq data with or without a reference genome.” BMC Bioinformatics, 12:323
- Robinson MD, McCarthy DJ and Smyth GK (2010). “edgeR: a Bioconductor package for differential expression analysis of digital gene expression data.” Bioinformatics, 26, pp. -1
- Subramanian, A., Tamayo, P., Mootha, V. K., Mukherjee, S., Ebert, B. L., Gillette, M. A., Paulovich, A., Pomeroy, S. L., Golub, T. R., Lander, E. S., and Mesirov, J. P. (2005). Gene set enrichment analysis: A knowledge-based approach for interpreting genome-wide expression profiles. Proceedings of the National Academy of Sciences, 102(43):15545– 15550
_female")
