Genome-Wide Association Studies (GWAS) are a valuable approach to investigating the relationship between genetic variations and phenotypic traits. However, due to many different analysis options, performing GWAS can be challenging, especially for researchers without a strong background in statistics or bioinformatics.
OmicsBox’s Genetic Variation Module provides a solution by offering a user-friendly interface to powerful analysis tools. It includes a GWAS option that utilizes the GAPIT3 R package to make these analyses more straightforward.
This post will discuss the benefits of using OmicsBox for GWAS analysis and provide a step-by-step guide. It also highlights key considerations and best practices to ensure accurate and effective analysis.
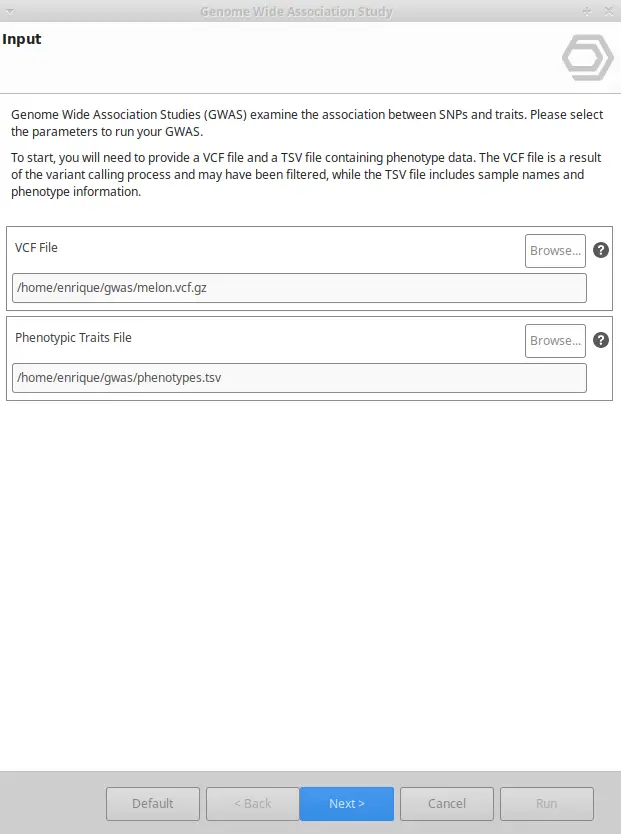
Main Input Files
To perform a GWAS analysis, you will require two files: a VCF file containing the variant information, and a traits file containing information about the phenotypes.
File #1. VCF File
The VCF file has information about the present variants for each sample. It can be obtained using any of OmicsBox’s ultra-fast Variant Calling Tools. After that, you will be able to select the most confident variants and discard low-quality alterations thanks to the Variant Filtering Tool.
File #2. Traits File
To create the traits file, provide a plain list of sample names with the corresponding values describing the different traits which need to be associated to the variants. This file has to be in TSV file format.
Create a Proper Dataset
Filtering:
Certain variant filters are common practice with GWAS to achieve significant results and more information can be found in this tutorial.
Along with filtering SNPs, you can also filter your VCF file based on population genetics parameters such as a p-value threshold to eliminate variants that violate Hardy-Weinberg equilibrium or a MAF threshold.
It is equally important to ensure that your phenotypic traits are normally distributed. If you believe that your data does not follow this distribution, use the normalization option.
GWAS Options
When doing a GWAS, these three aspects are vital and need to be well understood:
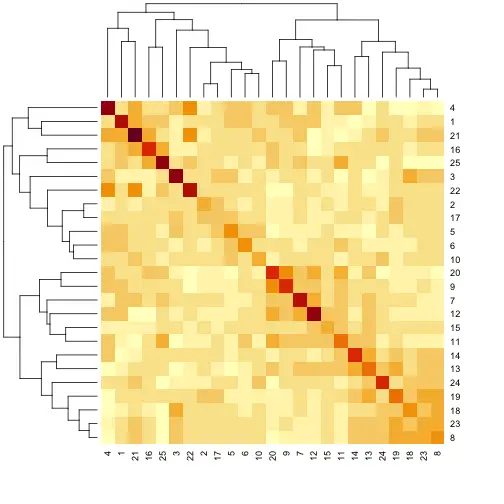
1. Kinship Matrix
Kinship, or the degree of genetic relatedness within a population, is a common confounding factor in GWAS. Confounding factors are variables that are associated with both the genetic variation and the phenotype being studied but are not the causal factor responsible for the observed association. In the case of kinship, genetic relatedness between samples can create false positive associations between genetic markers and phenotypes. Accounting for kinship helps distinguish true associations from false positives, by correcting for the effects of genetic relatedness between individuals.
To adjust for kinship, researchers can add their own kinship matrix to the analysis. However, to simplify the GWAS process, OmicsBox offers an automatic kinship calculation feature.
By accounting for kinship, researchers can better identify true associations between genetic variants and phenotypes, leading to more accurate and reliable results in GWAS.
..
2. Covariate Matrix
In addition to the kinship matrix, the covariate matrix is another tool used to account for confounding factors in GWAS, such as age, sex, or environmental factors that may influence the trait of interest. Including these factors in the analysis can improve the accuracy of the results by controlling for their effects.
If unsure about how to obtain the covariate matrix, OmicsBox allows calculating it automatically using the VCF file.
3. Model
The correlation between a trait and population structure can vary depending on the analysis method used, leading to different optimal models. However, performing a GWAS using OmicsBox is easy, and we recommend running the experiment with multiple models to compare the results. Additionally, QQ-Plots can be used as a quality control measure to determine if a model is appropriately adjusted.
To get a better idea of the different GWAS models, the following paper might be useful: “Comparing Different Statistical Models and Multiple Testing Corrections for Association Mapping in Soybean and Maize” Article. Figure 2. Kinship Matrix Figure 3. PCA in OmicsBox of the Covariate Matrix. Samples are colored according to phenotype values.
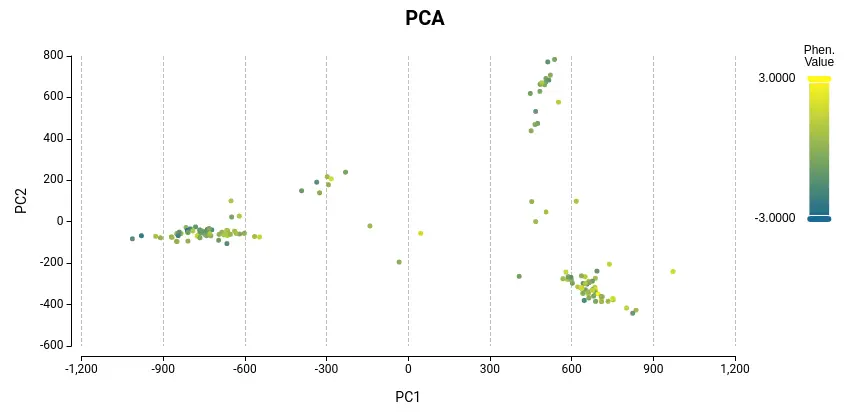
Figure 3. PCA in OmicsBox of the Covariate Matrix. Samples are colored according to phenotype values.
Analyse Your Results
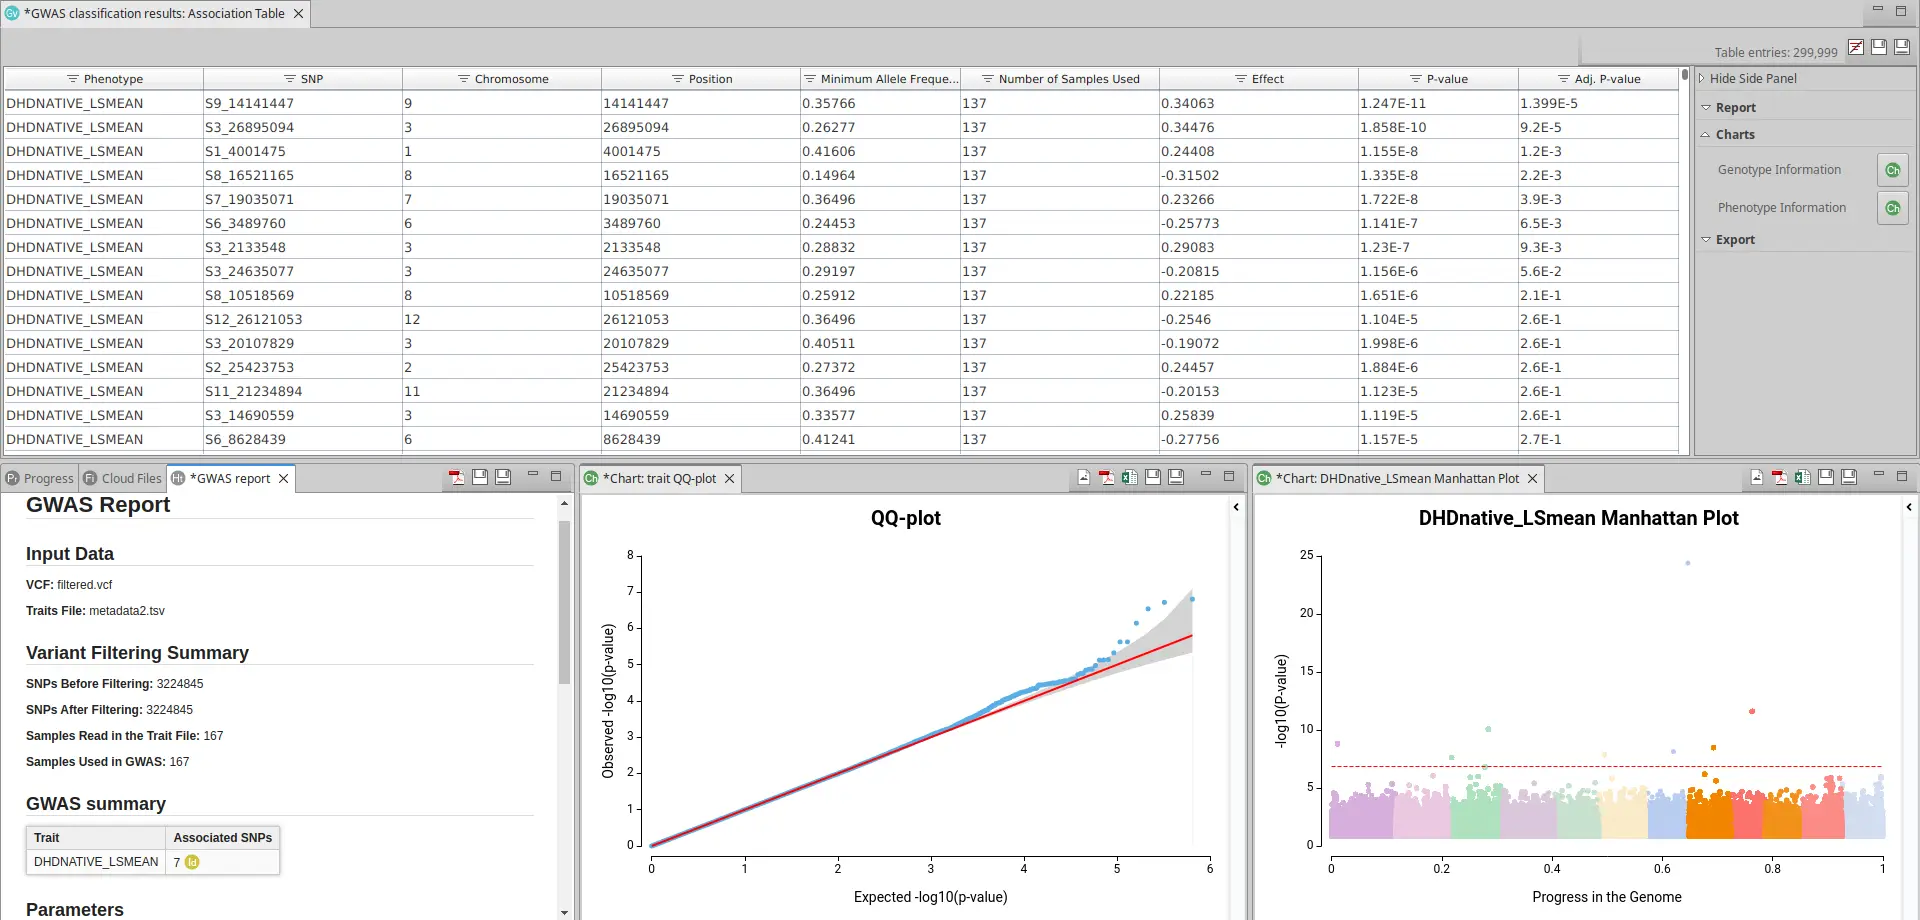
Once you have run GWAS with the proper model, you will receive a table with information on the different variants in each of the different phenotypic scenarios. In addition, you will see a Summary Report with information about the number of variants and samples used and a small table with the number of significant variables per phenotypic trait (See Fig. 4).
To see if this model is suitable for your data, you should click in the sidebar in Charts > Phenotype Information > QQ-plots. A QQ-plot is used in GWAS to check if the distribution of p-values follows the expected uniform distribution. A good QQ-plot should show a diagonal line, indicating that the observed distribution of p-values follows the expected distribution, with only a few deviations near the top of the plot indicating significant associations. If the observed distribution deviates significantly from the expected distribution, it suggests potential errors or biases in the data that require further investigation.
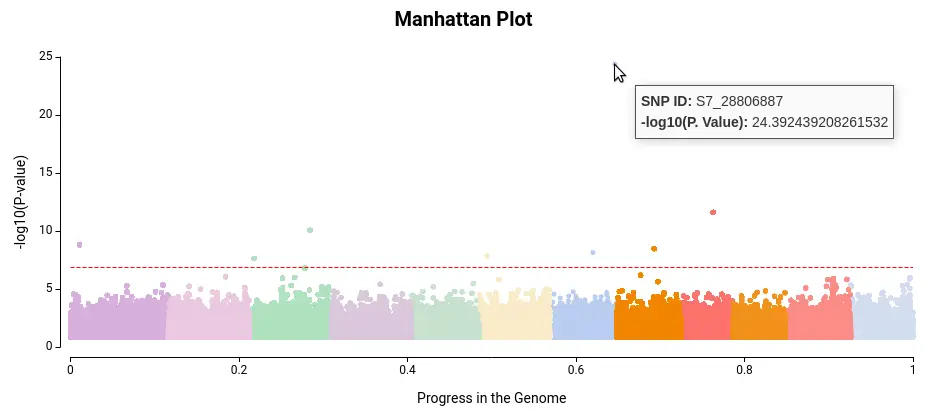
Once you have ensured that your model is appropriate for your data you should look at the Manhattan Plot (Charts > Phenotype Information > Manhattan Plot). A Manhattan Plot is a graphical representation tool to display the results between genetic variants and a phenotype of interest. In a Manhattan Plot, each point represents a genetic variant tested for association with the phenotype, and the height of the point indicates the strength of the association (as in Fig. 5).
GWAS in OmicsBox
-
- Performing a GWAS with OmicsBox is straightforward, requiring only a VCF and a traits file. This ease of use is particularly helpful for new users.
-
- Experienced users have the option of adding custom information, such as Kinship and Covariate Matrix.
-
- OmicsBox provides intuitive wizards with additional help, guiding users through every step of the GWAS analysis.

References
Lipka, A. E., Tian, F., Wang, Q., Peiffer, J., Li, M., Bradbury, P. J., … & Zhang, Z. (2012). GAPIT: genome association and prediction integrated tool. Bioinformatics, 28(18), 2397-2399.
Visscher, P. M., Brown, M. A., McCarthy, M. I., & Yang, J. (2012). Five years of GWAS discovery. The American Journal of Human Genetics, 90(1), 7-24.
About the Author

With a biological and technological academic background, including a BSc in Biotechnology and an MSc in Bioinformatics, Enrique’s expertise lies in the areas of Long Reads and Genetic Variation.

