Single-cell RNA sequencing (scRNA-seq) has proven its usefulness in deciphering biological processes. Since it allows the study of samples at the cell level, it provides a more detailed view of the underlying biology.
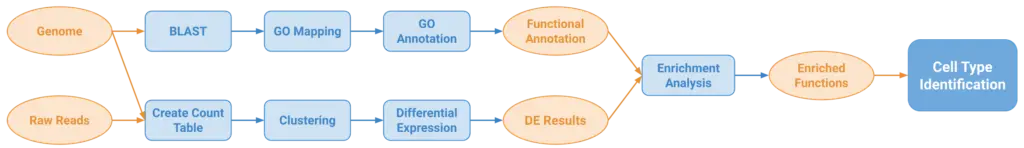
A nearly mandatory step in any scRNA-seq analysis is to identify the cell types present in the analyzed samples so further biological insights can be obtained. However, standard approaches require prior information (e.g marker genes) that is not commonly available for non-model organisms, making cell type annotation difficult for such organisms. OmicsBox is committed to developing tools for analyzing any kind of species, so we aimed to build a pipeline (Figure 1) for identifying cell types suitable for non-model organisms. Only a reference genome or transcriptome is required, something commonly available when characterizing a novel species.
The first step of the pipeline consists of Clustering single-cell RNA-seq data. This step finds groups of cells with similar expression patterns which putatively correspond to cell types. Next, Differential Expression Analysis is performed for each cluster. With these results, a Fisher’s Exact Test is performed to obtain the enriched functions representing biological processes relevant for a given cluster compared to the rest. Finally, by studying these functions within the biological context and knowledge, cell types can possibly be inferred.
For benchmarking purposes, this pipeline was applied to an eye-disc Drosophila melanogaster dataset consisting of 15 annotated cell types. This served as ground truth to further validate the results obtained with the presented approach. The dataset contains cells from 14 different organisms, 11 wild-types and 3 Rbf-mutants.
Data availability
Raw sequencing data, gene expression matrices, and metadata are available in Gene Expression Omnibus (GEO: GSE115476).
All files used for the analysis in OmicsBox can be found here.
This blog is an extended version of the poster presented at the 2022 European Conference on Computational Biology (ECCB2022). Please find an online version of the poster here.
Bioinformatic Analysis
Functional Annotation
To obtain enriched biological functions, a functional annotation needs to be generated first. Functional annotation is an OmicsBox project containing gene names or IDs and the GOs linked to them. It is possible to obtain it following the Blast2GO[1] pipeline, which consists of BLAST > GO Mapping > GO Annotation steps.
The BLAST step needs gene/transcript-like sequences as input, that is, it is not thought for whole genomic sequences (chromosome-level). In order to divide the genome into gene sequences, the Load FASTA from Reference + GFF/GTF tool was used. If no GFF is available, then a Gene Finding can be performed. Starting from a fasta file, this tool will predict the genes and produce both a fasta with CDS sequences and a GFF file. The CDS fasta file can be directly used for BLAST.
Moreover, we used CloudBlast to speed up the process. CloudBlast is a BLAST service totally independent of the NCBI servers to provide fast and reliable sequence alignments. It consists of a high-performance computing cluster dedicated exclusively to Blast searches. Since we want to test the applicability of this procedure to non-model organism data, the BLAST search was performed against general taxa. For this use case, we used the Arthropoda phylum.
The GO Mapping step retrieves GO terms associated with the Hits obtained by the BLAST search. So, if we used general taxa during BLAST, we can benefit from the functional information available for other species. This fact is what makes the functional annotation suitable for non-model organisms. Finally, the GO Annotation step selects GO terms from the GO pool obtained by the Mapping step and assigns them to the query sequences. The selection is carried out by applying an annotation rule (AR) on the found ontology terms. The rule seeks to find the most specific annotations with a certain level of reliability.
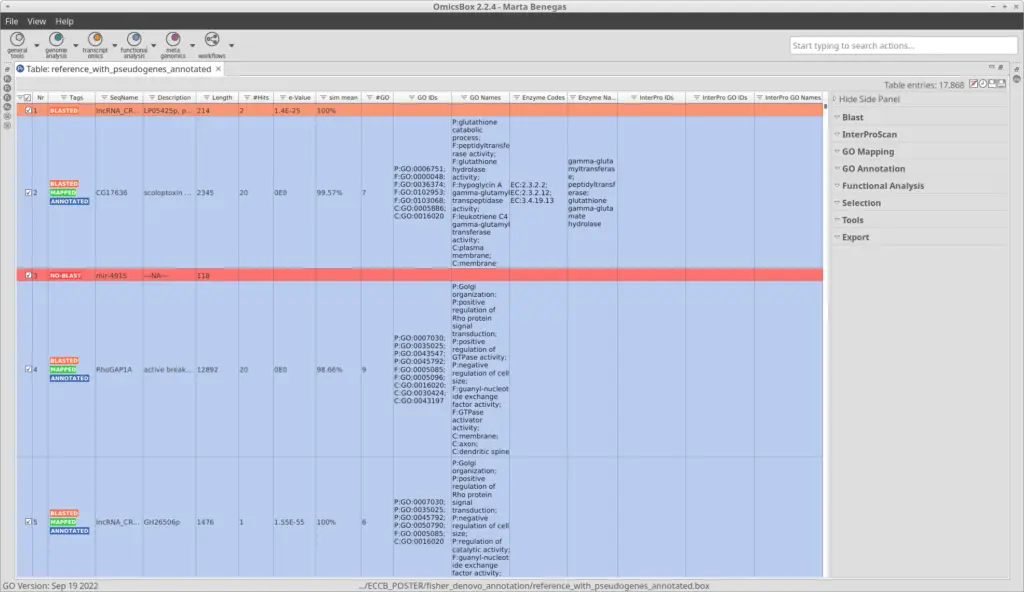
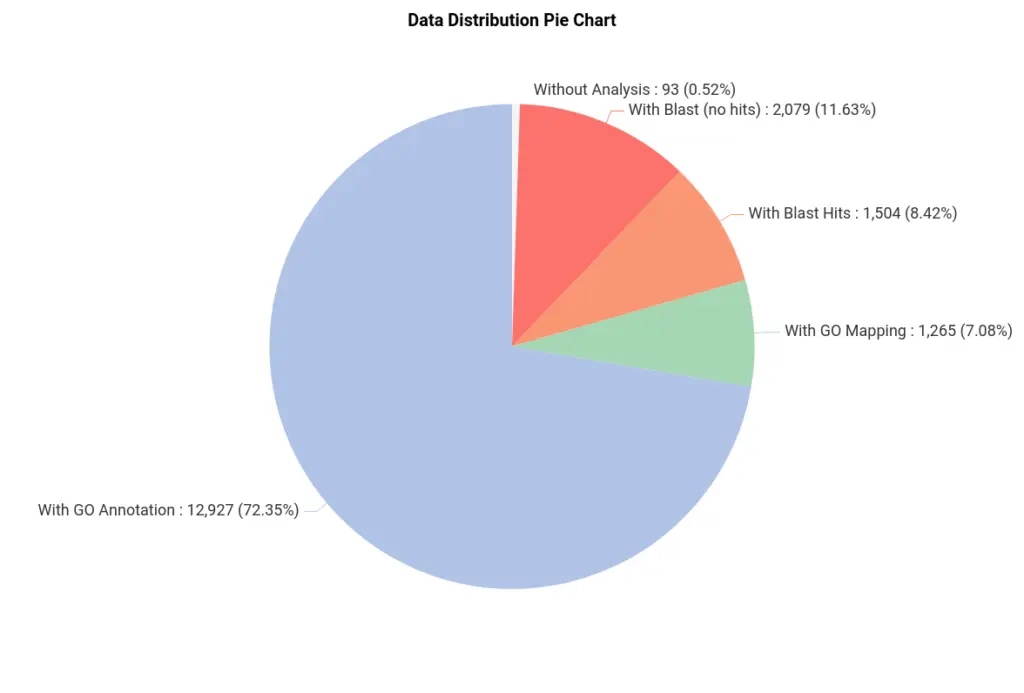
After the pipeline has been completed, we obtained a project with the sequences and all the information regarding the previous steps (Figure 2). We can see that most of the sequences were successfully annotated with GOs (Figure 3).
We have used blastx, which compares a nucleotide query sequence translated in all reading frames against a protein sequence database. So sequences with no blast hits (red in Figure 3) could correspond to non-coding sequences. Moreover, sequences in green have been GO-mapped but not annotated, meaning no GO has been found to be significantly mapped for those sequences. The threshold for annotating GOs can be modified in the GO Annotation wizard.
Single-Cell RNA-Seq Data Analysis
Create Count Table
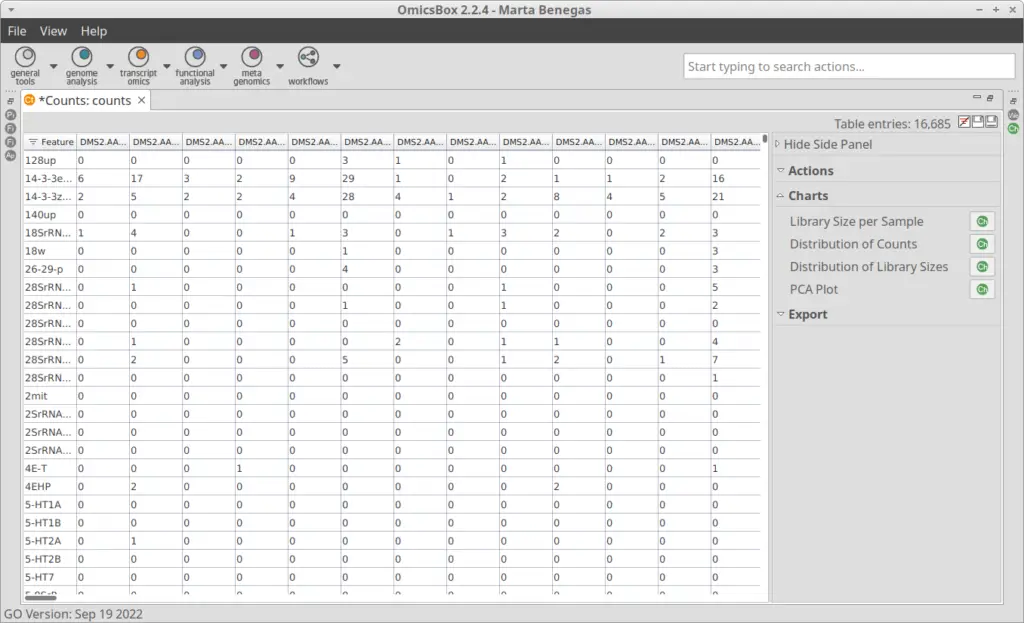
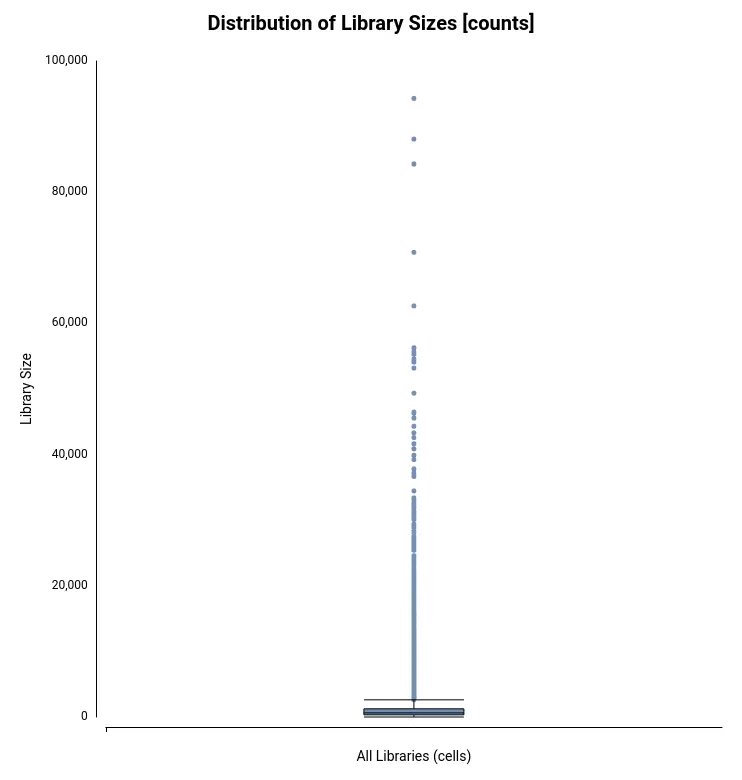
The Count Table, also known as Gene Expression Matrix, contains cells in columns, genes in rows, and values corresponding to gene expression levels. It was obtained by the authors of the original paper[2] with Drop-seq[3] toolkit. The count table in txt format can be loaded into OmicsBox (Figure 4) by going to transcriptomics > Load > Load Count Table (expression data). Plots for easy general visualization of the data can be generated from the side panel (Figure 5).
Clustering
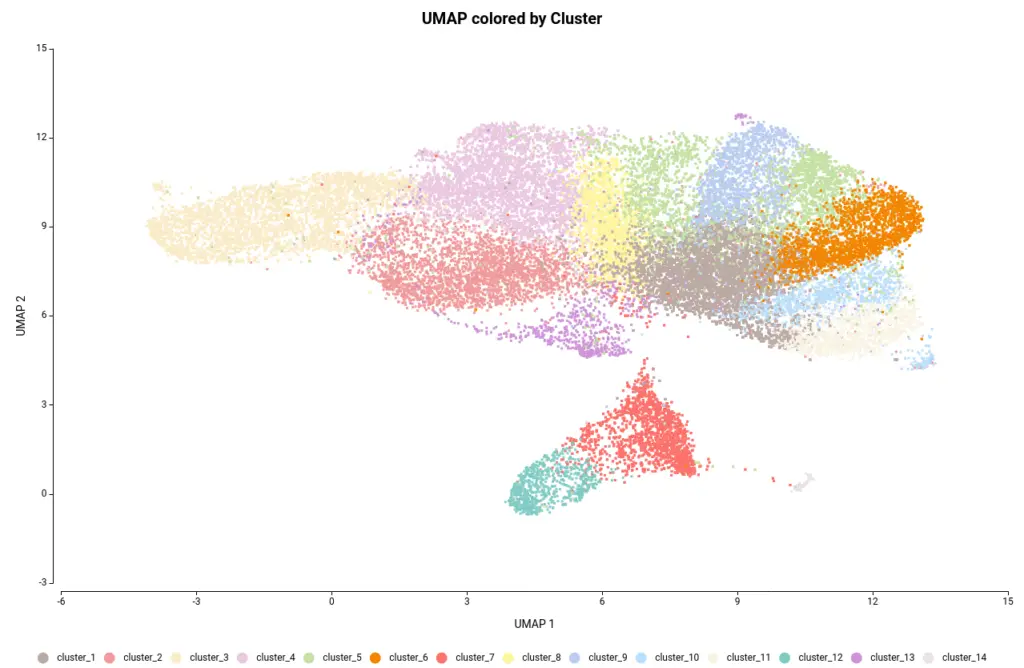
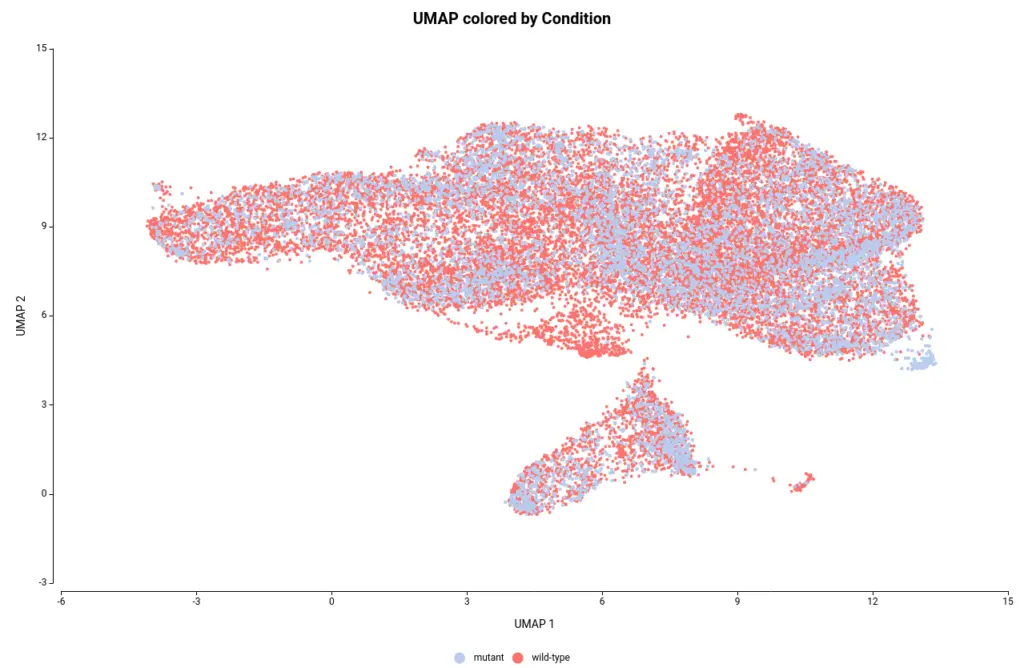
The OmicsBox’s tool to perform the clustering of Single-cell RNAseq data is based on the widely-used Seurat[4] R package. This analysis groups the cells in clusters with similar gene expression patterns, which should correspond to the same cell type. In addition, this tool performs the filtering and preprocessing of the data. So, as in the original paper[2], we filtered the features that are expressed in less than 3 cells and the cells with a minimum total number of detected features greater than 200 and lower than 3000. The normalization method used was Log Normalization and the number of dimensions used during clustering was set to 20. The rest of the parameters were left by default. Moreover, we provide an experimental design to integrate the data according to its condition. This would allow cells belonging to the same cell type to cluster together irrespective of whether they come from mutant or wild-type organisms.The Clustering resulted in 14 groups of cells (Figure 6). Each group putatively corresponds to a different cell type, but it is unknown at the moment. Moreover, thanks to the integration step each of the clusters is composed of both wild-type and mutant cells as seen in Figure 7, except cluster 13 which seems to be composed only of wild-type cells.
Cell Type Identification Based on Marker Genes
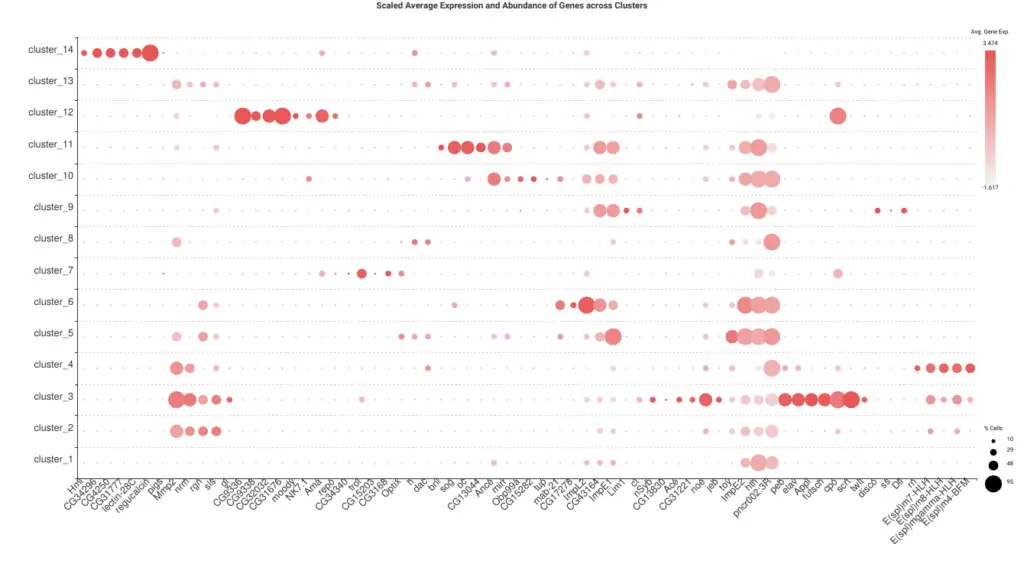
A common procedure to identify the cluster’s cell type is to look at the expression levels of known marker genes. We extracted a list of marker genes from the original paper[2] and generate an Expression Profile Dot Plot (Figure 8) with OmicsBox for easy visualization. By looking at the gene markers more expressed in each of the clusters, we manually assigned a cell type to each of them (Table 1). For clusters 1 and 13 no cell type could be directly inferred.
| Cluster | Original Cell Types |
| 2 | Early Photoreceptors |
| 3 | Late Photoreceptors |
| 4 | Morphogenetic Furrow |
| 5 | Undifferentiated Cells |
| 6 | Ventral Peripodial Epithelium |
| 7 | Perineurial Glia |
| 8 | Pre-proneural |
| 9 | Eye-Antennal Border + Antenna |
| 10 | Dorsal Peripodial Epithelium |
| 11 | Ocellar Complex |
| 12 | Wrapping + Subperineurial Glial Cells |
| 14 | Hemocytes |
| 1 | Unassigned |
| 13 | Unassigned |
However, this information is not commonly available for non-model organisms, so our purpose was to design an alternative pipeline to annotate the cell types. We used this manual annotation as ground truth to assess our results.
Differential Expression Analysis
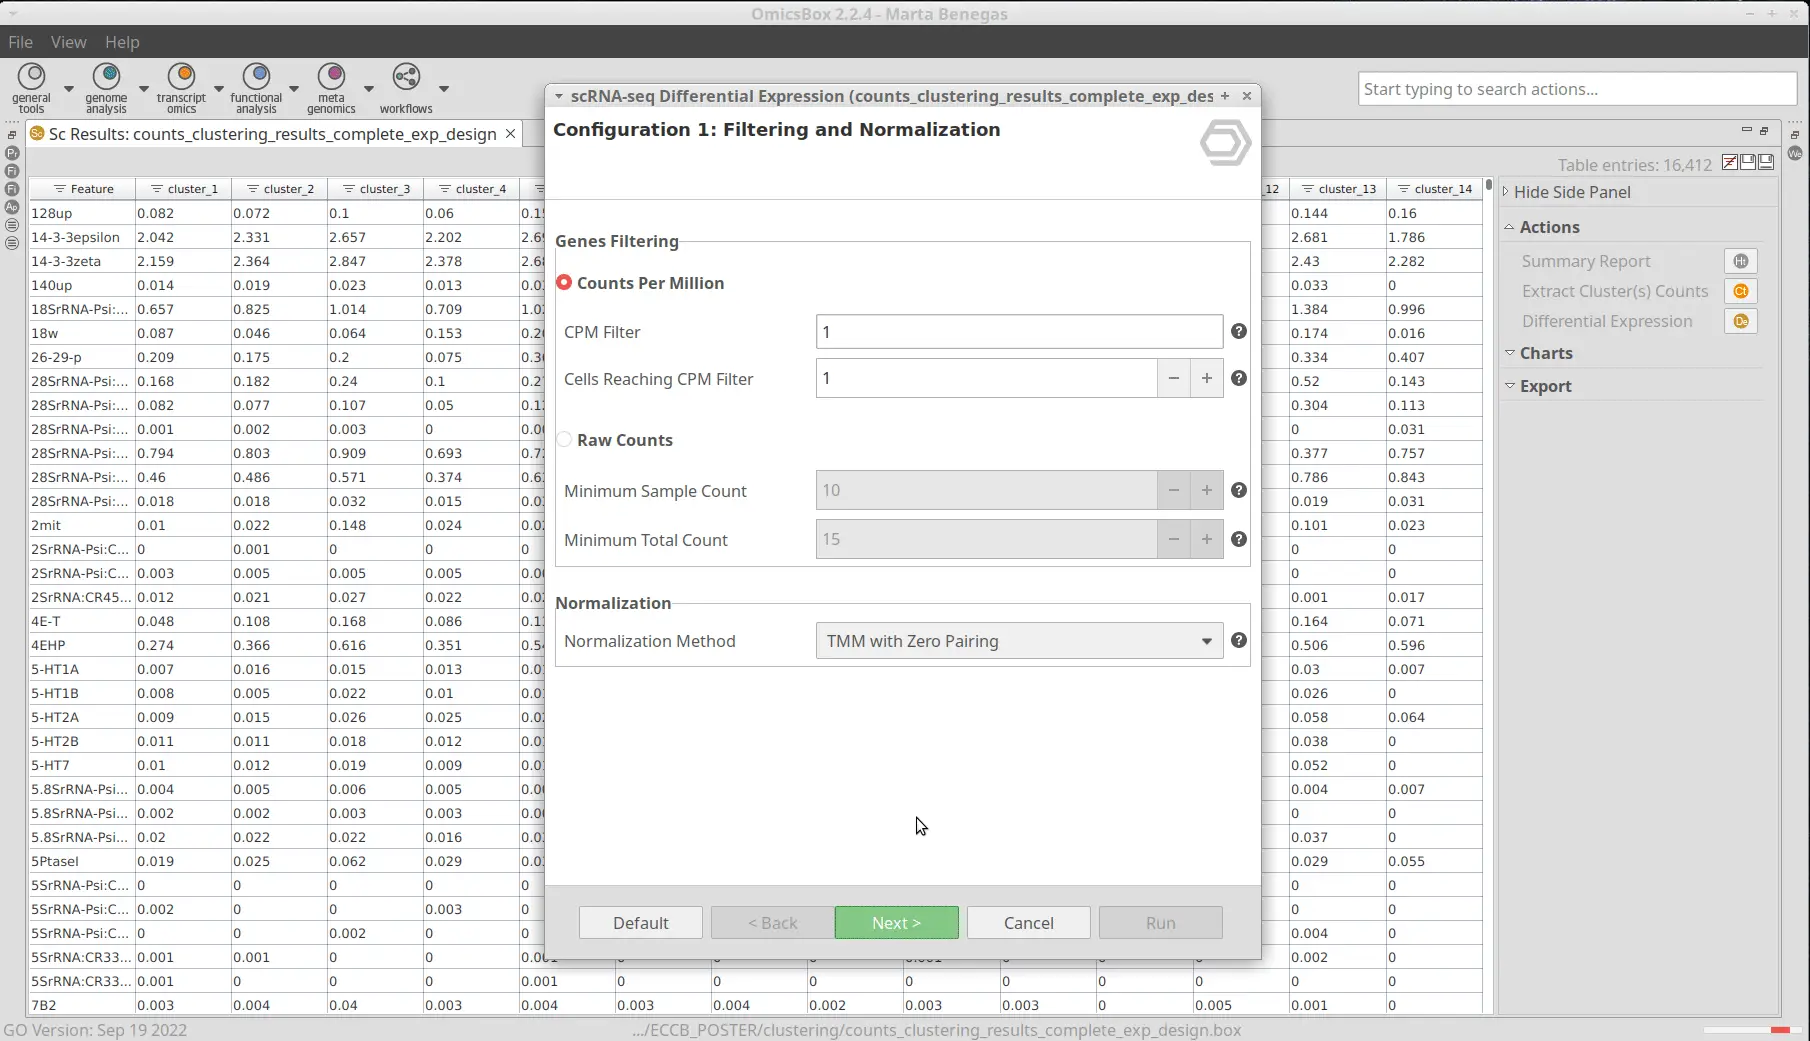
After the clustering, we performed a Differential Expression Analysis. We configured the analysis to test each of the clusters against the rest (Figure 9). In addition, we blocked the “condition” factor so the fact that a cell belongs to a mutant or wild-type organism doesn’t interfere with the DE assessment. This is because now we are interested to see differences between clusters (which putatively correspond to cell types), not between conditions. Moreover, we specified the “sample” factor in the “Biological Replicates” parameter so a pseudobulk analysis is performed. Please refer to this blog to see more details on how to configure the differential expression analysis.As a result, we obtained a table with statistics associated with each of the genes, from which we can infer the up-and-down-regulated genes for each cluster (Figure 10).
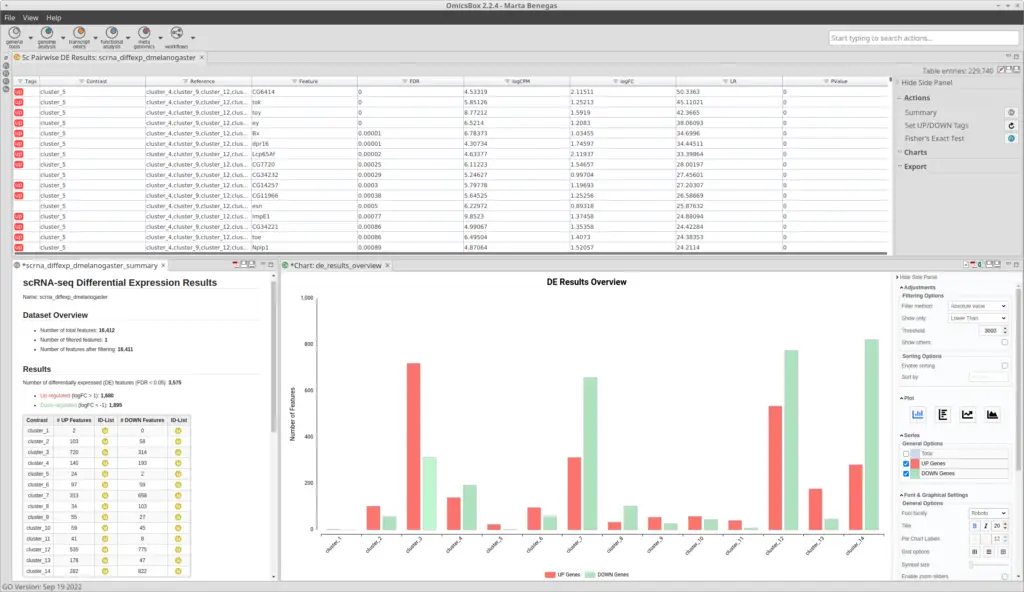
Functional Enrichment
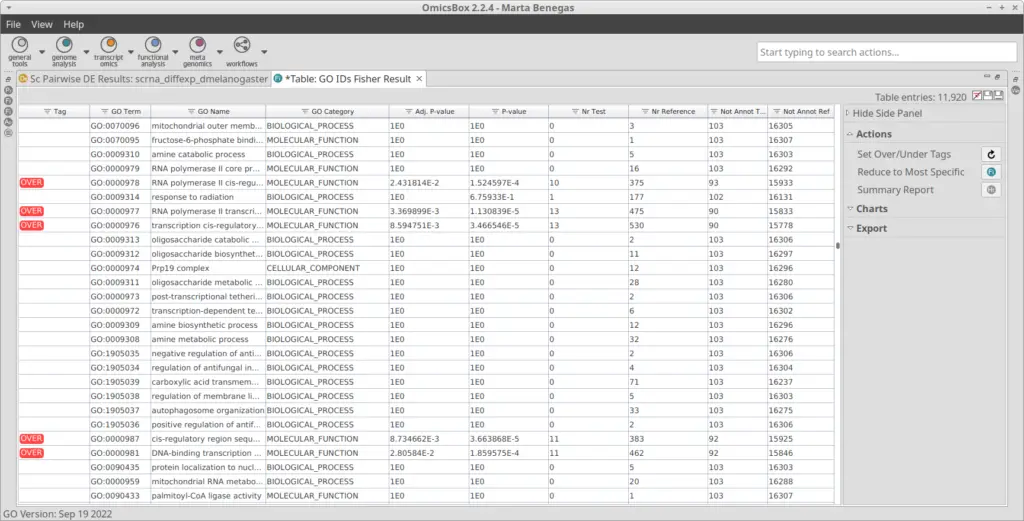
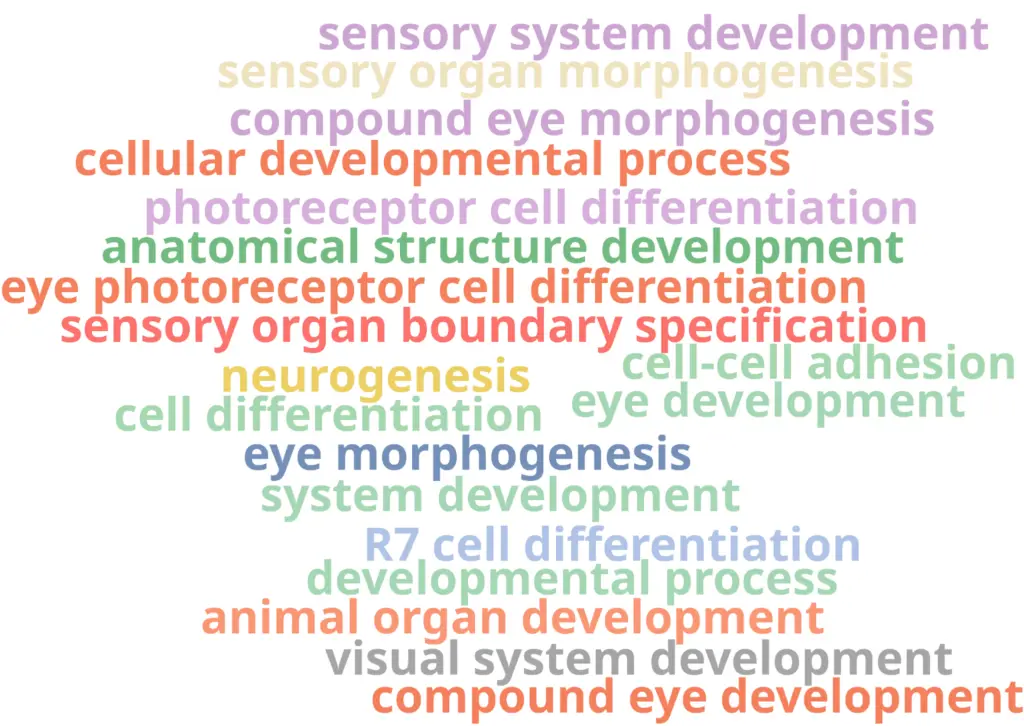
With the differential expression results and the functional annotation (obtained in section 2.1) we performed a Functional Enrichment Analysis. For each of the clusters, we performed a Fisher’s Exact Test to see if the genes labeled as up-regulated are enriched in particular functions if compared with the reference functional annotation. For each of the clusters, we obtained a table with GOs and their associated statistics (example in Figure 11). GOs were only labeled as over-enriched if the adjusted p-value was below 0.05. In order to visualize the results easily, we generated a Word Cloud for each of the clusters (example in Figure 12). This plot shows the names of the Top 20 most enriched GOs of the Biological Process category.
Manual Annotation
By looking at the most enriched functions and with biological knowledge, we were able to infer the cell types for most of the clusters (Table 2). We know that data come from the eye disc of larval fruit flies, so we have a prior idea of the cell types we would expect. For example, clusters 2 and 3 are quite straightforward to assign to a Photoreceptor, since they have the functions “Eye photoreceptor cell differentiation”, “Photoreceptor cell axon guidance”, and “R7 cell differentiation”. As another example, the Morphogenetic Furrow is known to have high levels of Notch signaling and it’s the cell barrier that starts the neuronal differentiation. Thus, with this biological background and looking at the enriched functions, it is possible to assign this cell type to cluster 4.
We followed the same procedure for the rest of the clusters, obtaining the results shown in Table 2. Rows colored in green show clusters for which the same cell type was obtained with both procedures. Rows in yellow represent clusters for which different cell types were inferred. Lastly, rows in red correspond to clusters for which no information was obtained; we weren’t able to assign a cell type based on marker genes nor any enriched function was found.
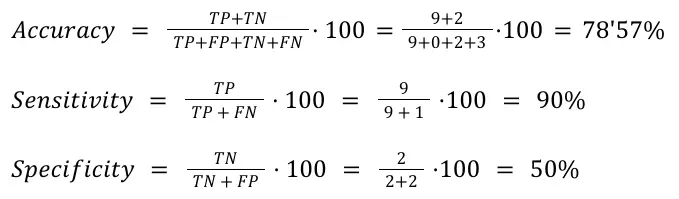
Based on these results, we assessed the Accuracy, Sensitivity, and Specificity of annotating the cell types based on functions in comparison with annotating them with marker genes. On this matter, we considered the cases in which the same cell type was identified with the marker genes and the enriched functions as a True Positive (TP). Otherwise, it is considered a False Negative (FN). If no cell type was inferred neither with gene markers nor with enriched functions, it is considered a True Negative (TN). Lastly, if a cell type was identified with the gene markers but not with the enriched functions, that’s a False Negative (FN). Following these considerations, we obtained the Confusion Matrix shown in Table 3, from which we calculated the statistics shown in Figure 13.
| Cluster | Enriched Functions | Original Cell Types | Inferred Cell Type |
| 2 | Eye morphogenesis, Eye photoreceptor cell differentiation, R7 cell differentiation | Early Photoreceptors | Photoreceptor |
| 3 | Photoreceptor cell axon guidance, R7 cell development, Notch signaling pathway | Late Photoreceptors | Photoreceptor |
| 4 | Nervous system development, Cell differentiation, Notch signaling pathway | Morphogenetic Furrow | Morphogenetic Furrow |
| 5 | Imaginal disc development, Animal organ development | Undifferentiated Cells | Undifferentiated Cells |
| 6 | Neuron differentiation, Imaginal disc-derived wing morphogenesis, Head morphogenesis | Ventral Peripodial Epithelium | Peripodial Epithelium |
| 7 | Mitochondrial translation, Cellular metabolic process, Glial cell development | Perineurial Glia | Perineurial Glia |
| 9 | Imaginal disc-derived leg morphogenesis, Antennal development, Specification of animal organ identity | Eye-Antennal Border + Antenna | Antenna |
| 12 | Septate junction assembly, Establishment of glial blood-brain barrier, Axonal fasciculation | Wrapping + Subperineurial Glial Cells | Wrapping + Subperineurial Glial Cells |
| 14 | Innate immune response, Regulation of immune system process | Hemocytes | Hemocytes |
| 8 | Eye-antennal disc development, Head development | Pre-proneural | Pre-proneural |
| 10 | Anatomical structure development, Embryo development, Imaginal disc development | Dorsal Peripodial Epithelium | Undifferentiated Cells |
| 11 | No enriched functions found | Ocellar Complex | Unknown |
| 1 | No enriched functions found | Unidentified | Unknown |
| 13 | No enriched functions found | Unidentified | Unknown |
| Cell Type | No Cell Type | |
| Match | TP | 9 | TN | 2 |
| No Match | FP | 2 | FN | 1 |
Discussion
OmicsBox allows the analysis of Single-Cell RNA-Seq data from gene expression level to functional characterization. We have seen that the tools available in OmicsBox allow for a manual characterization of the cell types present in a scRNA-seq experiment. It was possible even with little prior knowledge, which makes this procedure suitable for non-model organisms as well. The cell type annotation using marker genes is more precise since it was capable to discern between subtypes (see clusters 2 and 3 in Table 2). Moreover, it identified more cell types than the assignation based on enriched functions (see cluster 11 in Table 2). However, in the case of lacking this information, we have seen that looking into the enriched functions is a good approach to have a first glance at the cell type composition of the sample. With this first identification, it is possible to obtain more biological insights about the sample. For example, comparing cells from the same type but under different conditions, further analyzing each cluster (re-clustering it, identifying potential marker genes, etc.).
Regarding the differences in the cell type assignation, more research has to be done on the matter. We used a different approach for the differential expression analysis than in the original paper, which could explain the difference in the results obtained, as well as another version of the clustering algorithm. Benchmarking with more datasets and fine-tuning the pipeline are needed.
References
- Götz, S., Garcia-Gomez, J., Terol, J., Williams, T., Nagaraj, S., Nueda, M., Robles, M., Talon, M., Dopazo, J. and Conesa, A., 2008. High-throughput functional annotation and data mining with the Blast2GO suite. Nucleic Acids Research, 36(10), pp.3420-3435
- Ariss, M., Islam, A., Critcher, M., Zappia, M. and Frolov, M., 2018. Single cell RNA-sequencing identifies a metabolic aspect of apoptosis in Rbf mutant. Nature Communications, 9(1).
- Macosko, E., Basu, A., Satija, R., Nemesh, J., Shekhar, K., Goldman, M., Tirosh, I., Bialas, A., Kamitaki, N., Martersteck, E., Trombetta, J., Weitz, D., Sanes, J., Shalek, A., Regev, A. and McCarroll, S., 2015. Highly Parallel Genome-wide Expression Profiling of Individual Cells Using Nanoliter Droplets. Cell, 161(5), pp.1202-1214
- Butler, A., Hoffman, P., Smibert, P. et al. Integrating single-cell transcriptomic data across different conditions, technologies, and species. Nat Biotechnol 36, 411–420 (2018). https://doi.org/10.1038/nbt.4096
About the Author
 Marta Benegas
Marta studied biotechnology at the Valencia Polytechnic University (UPV) and continued her studies with a Master's in Bioinformatics at the Autonomous University of Barcelona (UAB), Spain. After her master's degree, she started her professional career at Biobam where she is now working as a bioinformatics specialist and support manager. At the moment she is mainly focused on Single-Cell technologies developing various pipelines which allow getting from reads to functional insights at a single-cell resolution. These developments are available in OmicsBox, BioBam’s software solution.

