What is a Gene Venn Diagram?
A Gene Venn Diagram is a graphical representation in the form of overlapping circles widely used to represent relationships among different genes (IDs).
High-throughput sequencing technologies generate large amounts of data sets coming from multiomics studies. At the transcriptomic level, differential expression analysis appears to be a highly important field of study in bioinformatics considering that it accelerates the understanding of cell biology by studying the phenotypic variation present in differentially expressed genes under various conditions.
Venn Diagrams for Bioinformatics Analysis
Data generated in transcriptomics must be accurately and efficiently analyzed with adequate tools. In this sense, a practical and convenient tool is a Venn diagram. Therefore, this gene expression diagram is a graphical representation of overlapping circles widely used to represent and highlight mutually expressed genes from different datasets.
In bioinformatics, a gene Venn diagram is a popular graph to compare subsets. For instance, when running a pairwise differential expression analysis, it might be interesting to rapidly visualize expressed genes that overlap between different groups (e.g. control vs. treatment).
Create ID Lists And Compare Them With A Gene Venn Diagram Tool In OmicsBox
OmicsBox offers a Venn diagram maker bioinformatics tool which allows users to select multiple ID lists or ID value lists in the text (.txt) or OmicsBox (.box) format and to draw the intersection of the elements of the lists as Venn diagrams.
To that end, our bioinformatics solution enables an easy generation of ID lists without using a text editor. Hence, users can create and compare ID lists of up-regulated or down-regulated genes right away and all in one place. This way, the gene expression diagram will show the overlaps (common genes) and differences between the gene lists.
List of Steps to Succeed in A Gene Venn Diagram Analysis:
To create an ID list of UP or DOWN regulated genes from a differential expression project and analyze their relationships, please do the following:
- Filter the table by the Tags column. Two filters: UP, DOWN, or both UP and DOWN regulated genes.
- Mark all filtered entries by Ctrl+A (Windows and Linux) or Command+A (Mac).
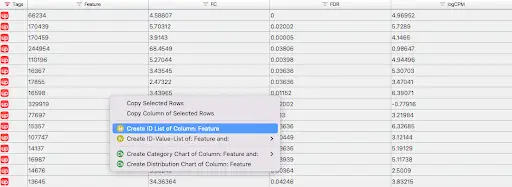
- Right-click on the SeqName column and click on the Create ID list of the column: Name option in the context menu (Figure 1). A new tab will open with the ID list of your entries.
- Save the list as a Blast2GO project (go to File –> Save).
- The Venn diagram tool is available under General Tools.
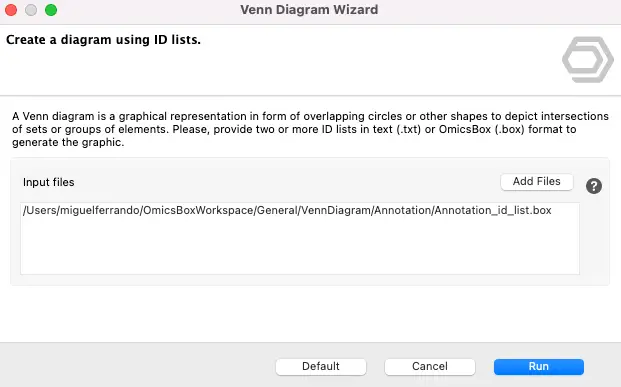
- Browse for the saved ID lists (Figure 2).
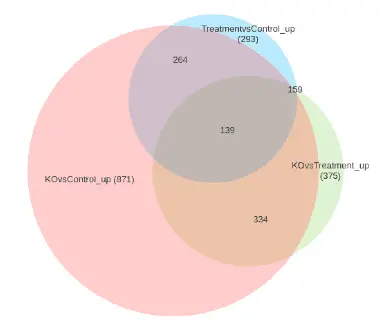
- Click Run and you will generate a Venn diagram (Figure 3).
Note: See OmicsBox user manual for more information on the Gene Venn Diagram parameters.