Unlocking Single Cell Insights with OmicsBox
Single Cell analysis has emerged as a powerful technique for unraveling cell biology and investigating tissue heterogeneity across diverse conditions. Thousands of scientific publications attest to its impact. However, the increasing amount of data and the complexity of analysis often pose challenges for researchers.
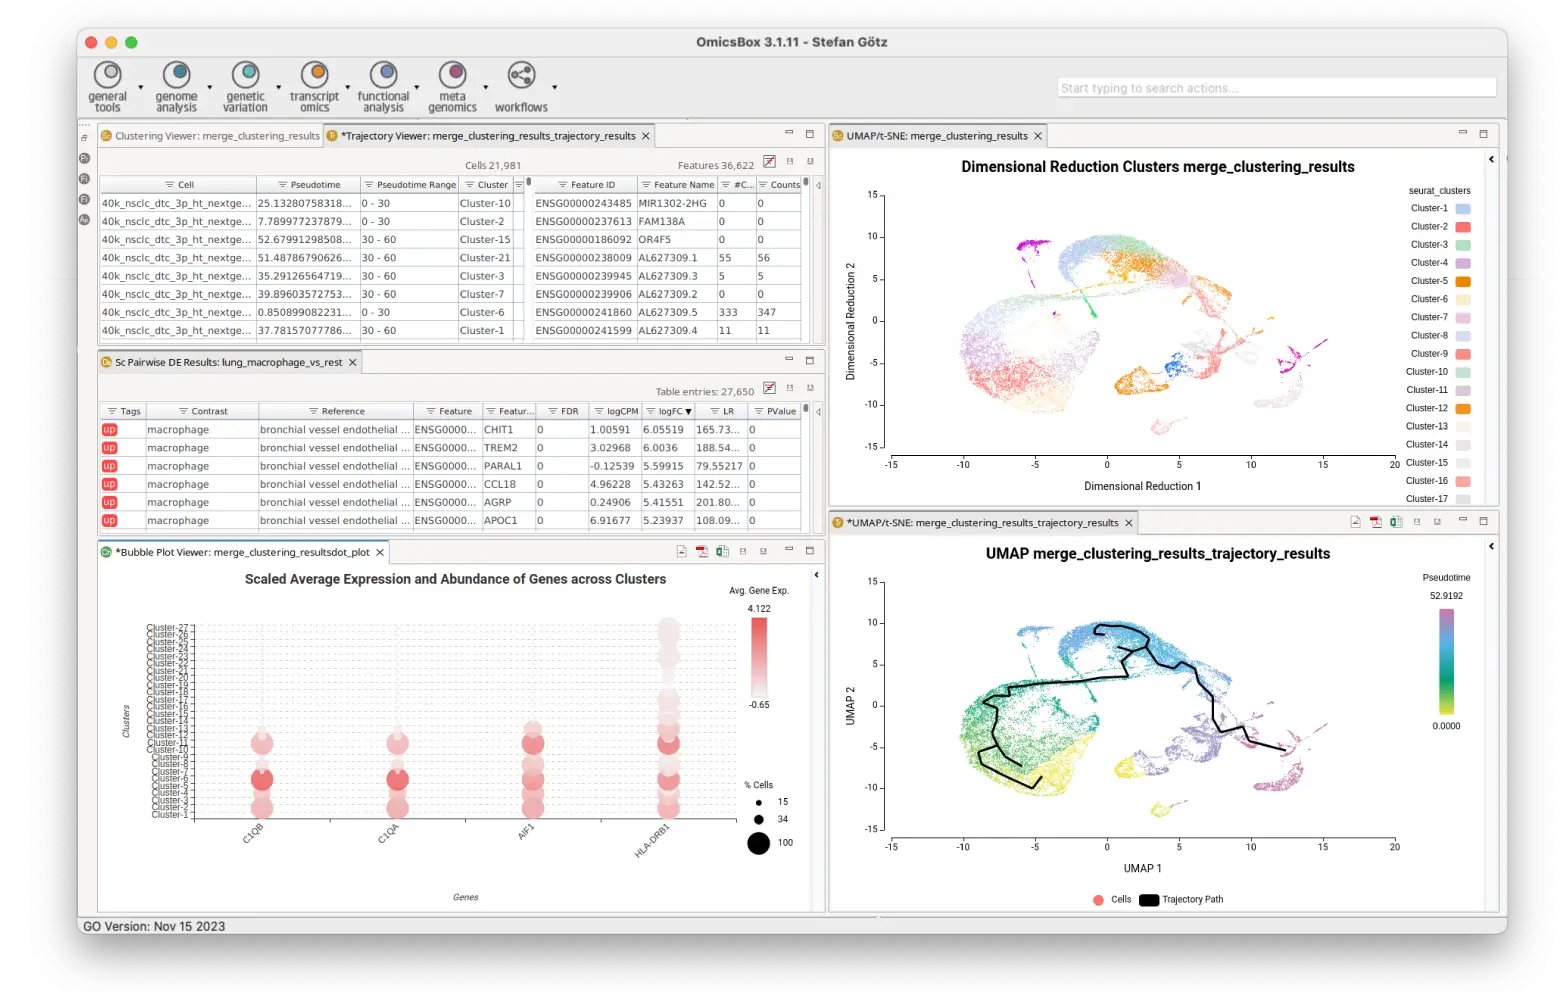
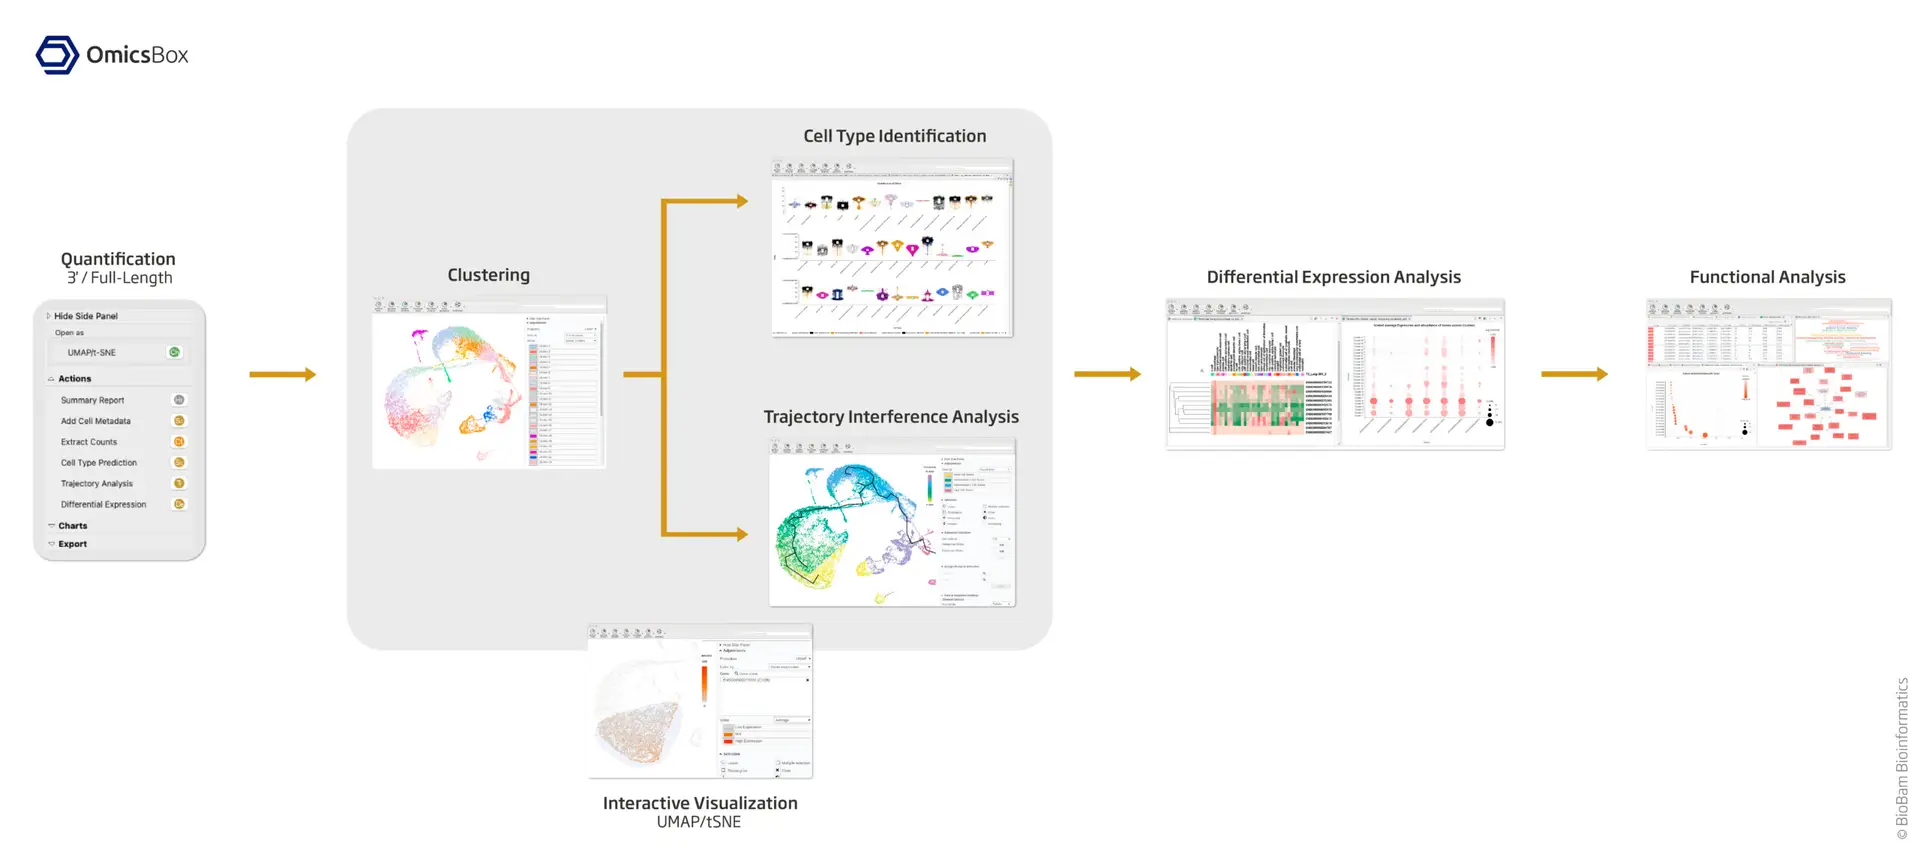
Our user-friendly platform makes Single Cell RNA-Seq analysis accessible to every scientist. From raw scRNA-Seq reads to functional data interpretation, OmicsBox streamlines the entire process. With a keen focus on dynamic data exploration and interactive visualizations, our integrated tools empower researchers to efficiently navigate complex datasets.
Features
- QUANTIFICATION
Use STARsolo for the quantification of scRNA-Seq reads. Compatible with both UMI-based (e.g. 10x Chromium, Drop-seq, etc.) and full-length (e.g. SMART-Seq, SmarTer) library construction technologies and highly customizable.
- CLUSTERING
Perform Seurat clustering with data preprocessing and correction. Additionally, a data integration step may be performed to analyze data coming from various samples (batches, conditions, etc.).
- VISUALIZATION
Rich visualizations to inspect your Single Cell data: violin plots, heatmaps, bubble plots, etc. Moreover, interactive UMAP and tSNE projections allow coloring cells by conditions or gene expression and select them to create personalized groups.
- CELL TYPE IDENTIFICATION
Predict the cell type of each cell in your dataset with SingleR by comparing your cells with an annotated reference. Assess the quality of the prediction with different visualizations.
- TRAJECTORY
Order your cells along the pseudotime with Monocle3 to study differentiation processes and identify developmental stages.
- DIFFERENTIAL EXPRESSION ANALYSIS
Compare the gene expression levels of different clusters, cell types, conditions, along pseudotime, etc. and perform functional enrichment analysis to gain biological insights of your data.
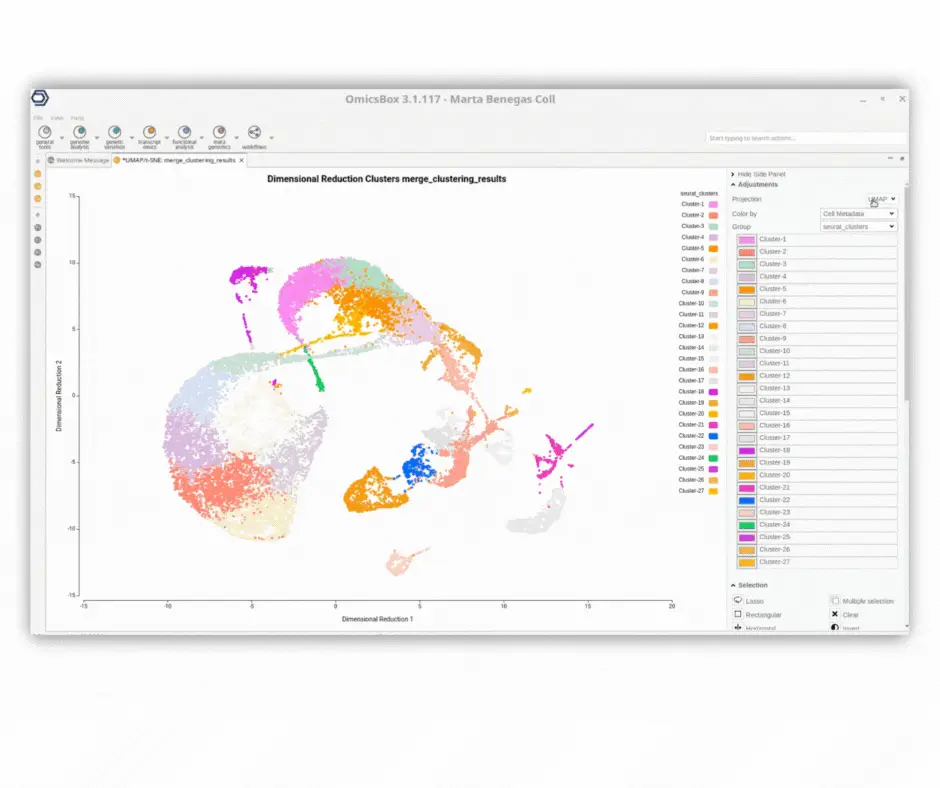
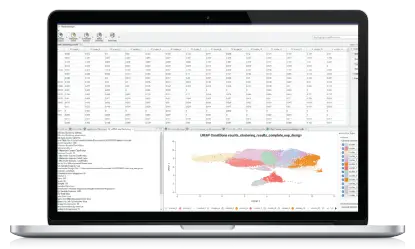
The interactive UMAP/tSNE viewer offers comprehensive capabilities for exploring single-cell datasets with precision.
· Customize cell coloring based on various cell metadata such as Seurat clusters, Monocle3 pseudotime, SingleR predicted cell types, sample origin, experimental conditions, and more.
· Visualize gene expression to discern sub-cell types and cell states, aiding in refining cell type predictions. The viewer supports simultaneous visualization of multiple genes with diverse transformations (e.g., average, sum, minimum, and maximum values).
· Combine different criteria to select cells belonging to multiple groups and/or meeting specific gene expression thresholds.
· Seamlessly interact with the UMAP/tSNE plot to dynamically select cells and assign them to custom groups.
Get Started with a Free Trial
Get familiar with all new Modules and Features
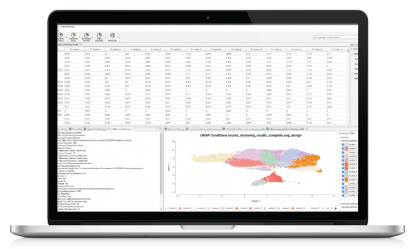
OmicsBox works out of the box on any standard PC or laptop with Windows, Linux and Mac.
Videos, Tutorials & More
Playlist

33:18

3:20

3:21

2:52
Keep reading about Single Cell
Case Study: Single Cell RNA-Seq Analysis
In this blog, we will reproduce the analysis performed by Shulse et al., 2019 and study the root of Arabidopsis thaliana…
