A simple use-case comparing OmicsBox with R chunks for Time Course Expression Analysis
The Blast2GO feature “Time Course Expression Analysis” is designed to perform time-course expression analysis of count data arising from RNA-seq technology. Based on the software package ‘maSigPro’, which belongs to the Bioconductor project, this tool allows the detection of genomic features with significant temporal expression changes and significant differences between experimental groups by applying a two steps regression strategy. This use case shows the basic analysis workflow, comparing the results obtained with R Bioconductor and Blast2GO.
DataSet
This use case explains the analysis of a real dataset that describes the transcriptional response of immunocompromised Arabidopsis thaliana lines to the barley powdery mildew fungus Blumeria graminis (GSE43163). The experimental design of this study has 48 samples: plants were challenged with either the Bgh (B. graminis) isolate K1 or the Bgh isolate A6, and three independent biological replicates per condition were harvested at 6, 12, 18 and 24 hours.
Download:
Video tutorial:
Analysis Workflow
-
Loading Data
The read counts for the 48 samples were stored in one tab-delimited file. In this case, raw counts without any type of normalization were provided.
|
maSigPro:
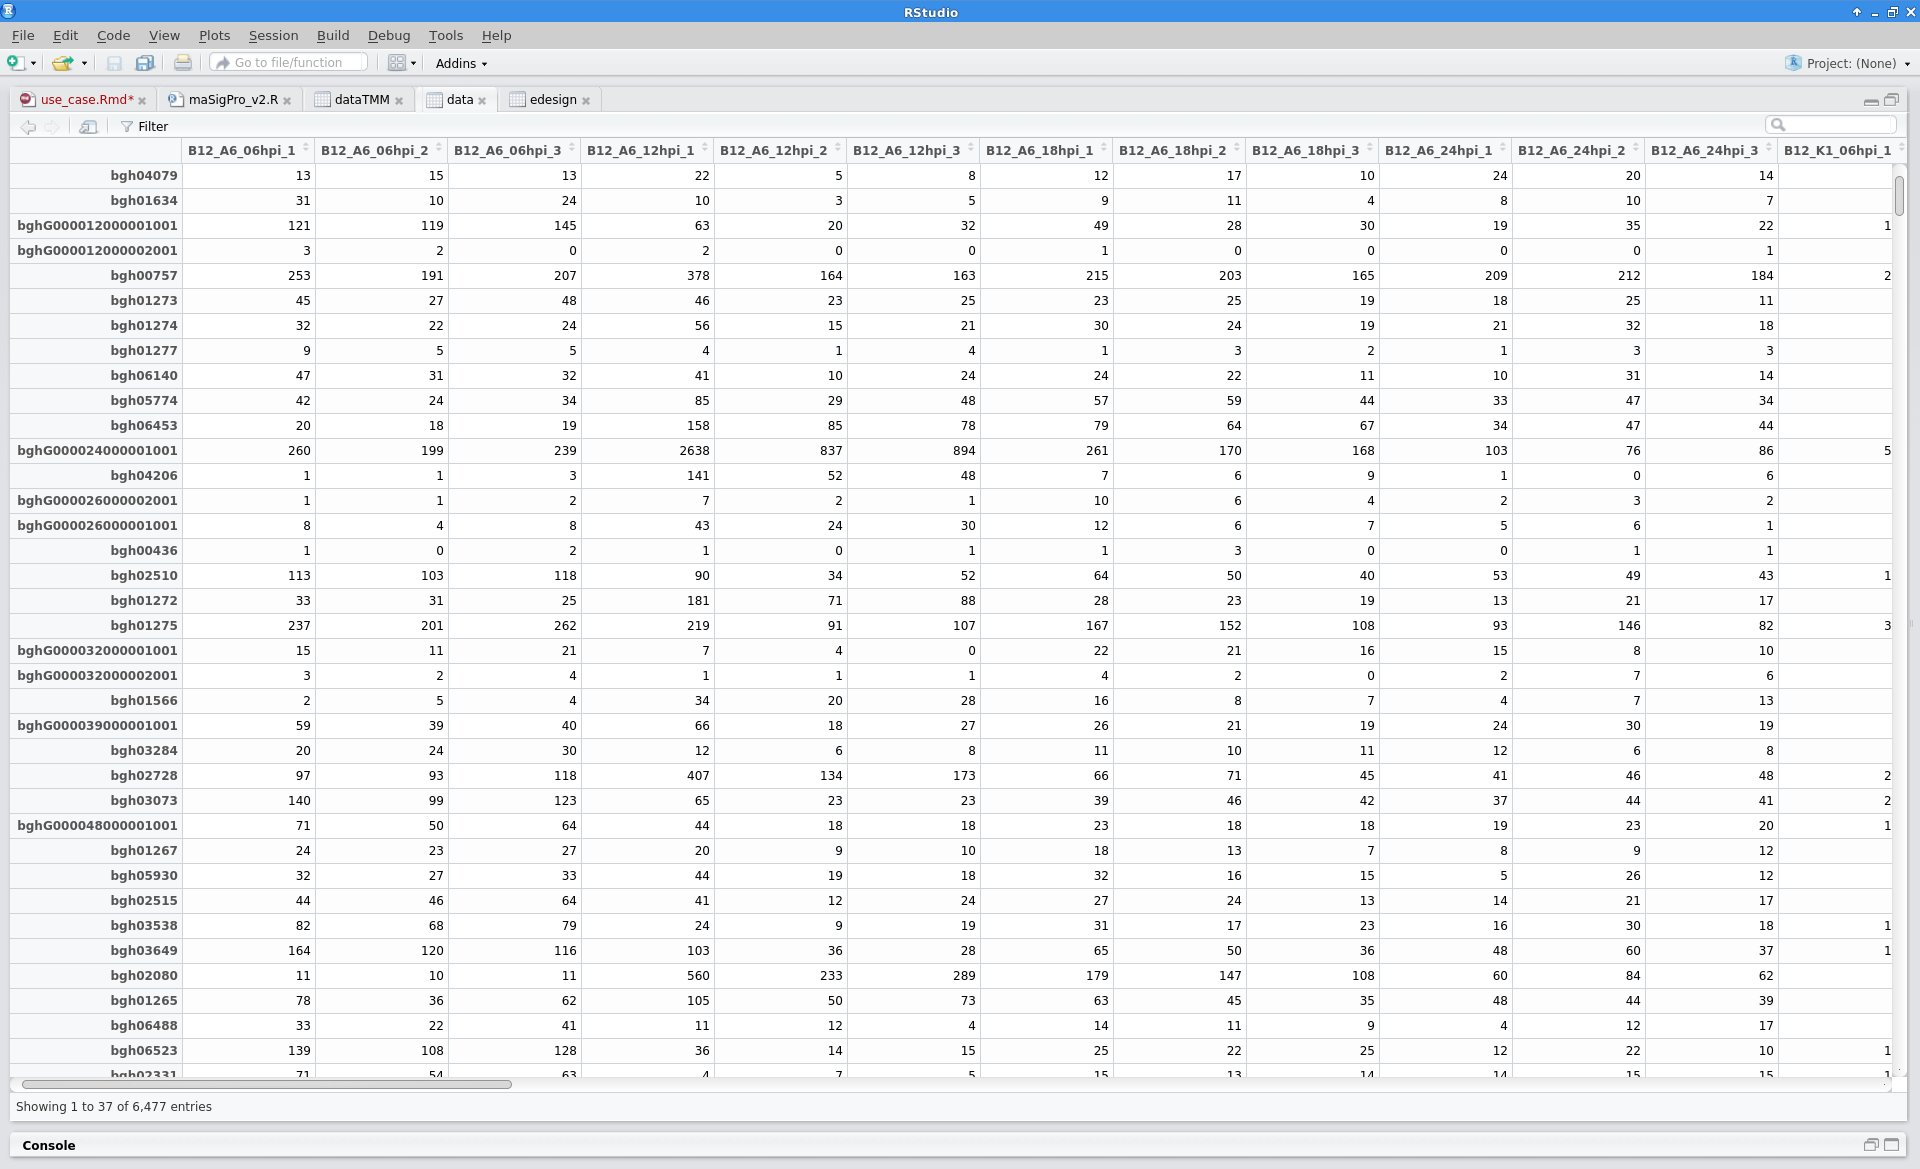
- The count table file is loaded in R using the ‘read.delim()’ command.
|
counts = read.delim("count_table.txt",
        check.names=F, stringAsFactors=F,
        row.names=1)
|
Blast2GO:
- The count table file is loaded into Blast2GO: File → Load → Load Count Table. Note that the data are nicely formatted, with gene names as row names and sample names as column names.
|
 |
-
Filtering and Normalization
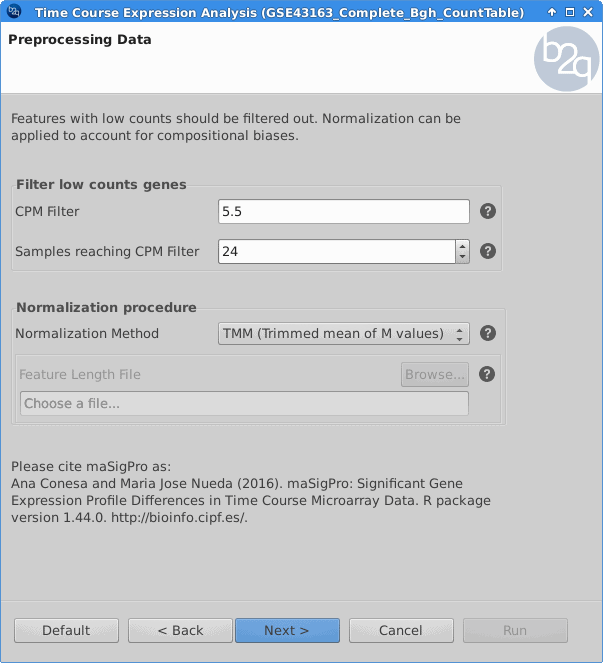
Genes with low counts should be eliminated since it makes no sense to test them for differential expression if they were not expressed. The used filter for this case excludes genes which are not being expressed in at least one experimental condition. In order to make the samples comparable and to remove possible biases, the TMM normalization method is applied.
|
maSigPro:
- The software packages ‘edgeR’ and ‘NOISeq’ (Bioconductor project) are used for this purpose.
|
##Filtering
library(edgeR)
dge = DGEList(counts=counts)
keep = rowSums(cpm(5.5)>=24
dge = dge[keep, , keep.lib.sizes=F]
filteredData = as.data.frame(dge$counts)

##Normalization
library(NOISeq)
normalizedData = tmm(filteredData,
        long=1000, lc=0)
|
|
Blast2GO:
- The adjustment of filtering and normalization steps is performed on the “Preprocessing Data” page of the main wizard: Diff Exprs → Run Differential Expression Analysis (“Time Course Expression Analysis” option).
|
 |
-
Experimental Design
The experimental design of this case corresponds to a replicated 4 time points course with two series (Bgh isolate A6 or K1).
|
maSigPro:
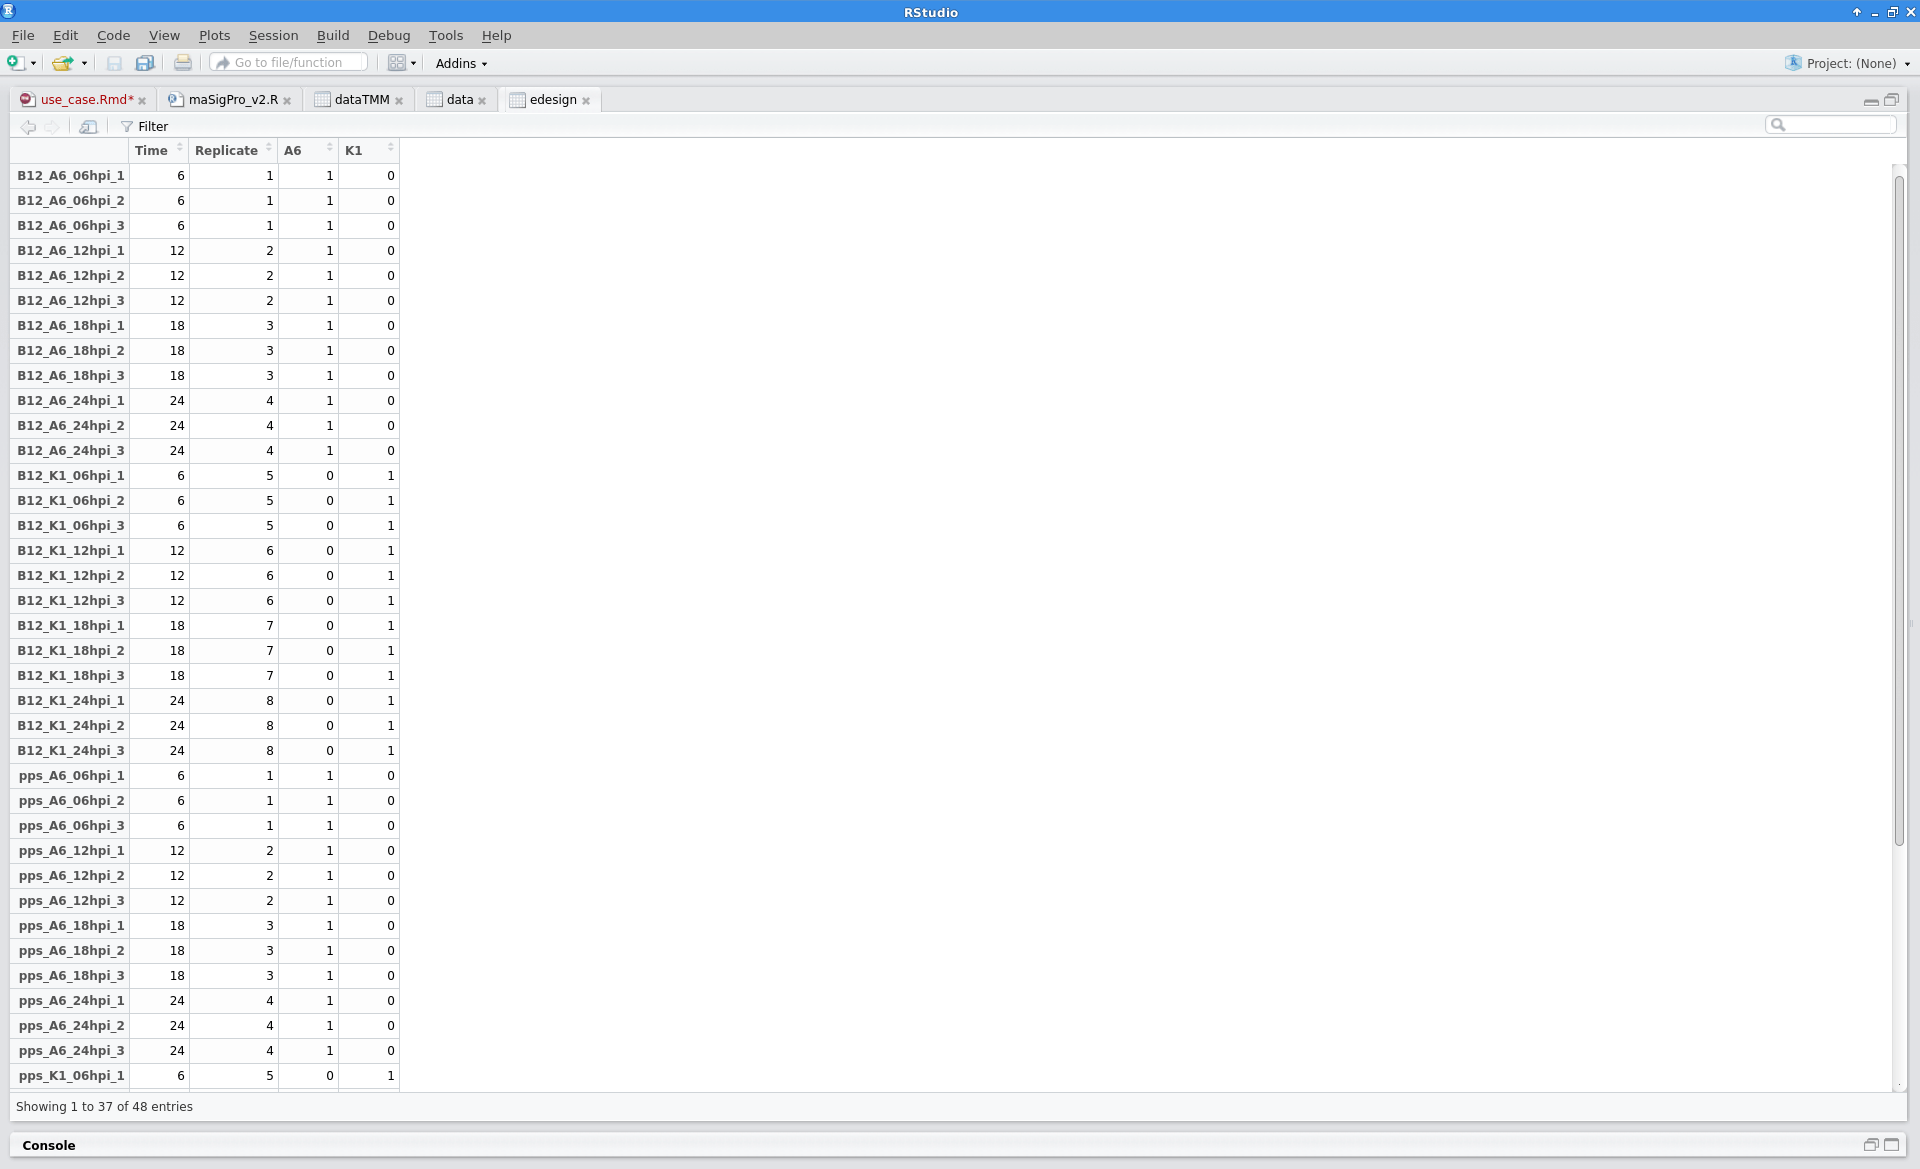
- The experimental design file is loaded in maSigPro format. Samples are given in rows and experiment descriptors are provided in columns:
- The first column shows the value that variable Time takes in each array.
- The second columns is an index column that indicates the replicated samples.
- The remaining columns are binary columns that give the assignment of samples to experimental groups.
|
edesign = read.delim("design.txt",
        check.names=F, stringsAsFactors=F,
        row.names=1)
 |
|
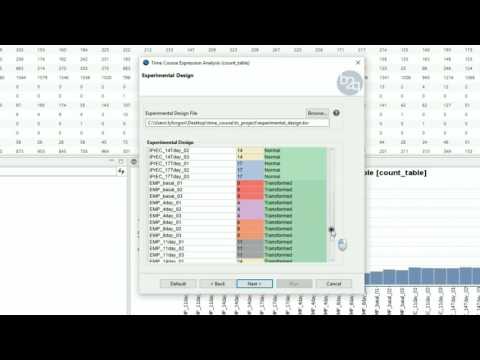
Blast2GO:
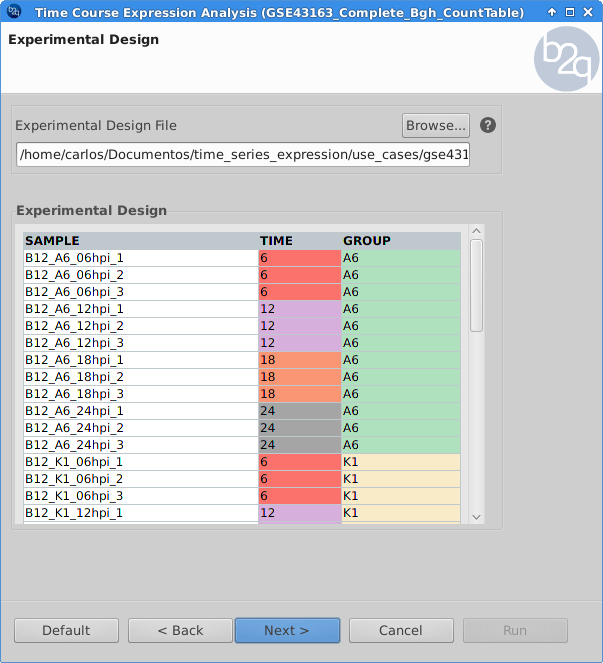
- On the “Experimental Design” page of the main wizard, users can load the experimental design file in tab-delimited format. Each row correspond to one sample. A column must contain the associated time points for each sample, and another column should show the assignment of samples to experimental groups.
|
 |
-
Time Course Expression Analysis
The software package maSigPro follows a two steps regression strategy to find genes that show significant expression changes over time and between experimental groups. Plants that were challenged with the BGh isolate A6 were treated as the control condition.
|
maSigPro:
- The analysis approach implemented in maSigPro is executed in 4 major setps which are run by the package core functions: make.design.matrix(), p.vector(), T.fit() and get.siggenes() .
|
library(maSigPro)

design = make.design.matrix(edesign=edesign,
         degree=2)

fit = p.vector(data=normalizedData,
        design=design,  Q=0.05,
        counts=T, min.obs=7)

tstep = T.fit(fit)

sigs.all = get.siggenes(tstep=tstep,
        rsq=0.5, vars="all")
sigs.group = get.siggenes(tstep=tstep,
        rsq=0.5, vars="groups")
sigs.each = get.siggenes(tstep=tstep,
        rsq=0.5, vars="each")
|
|
Blast2GO:
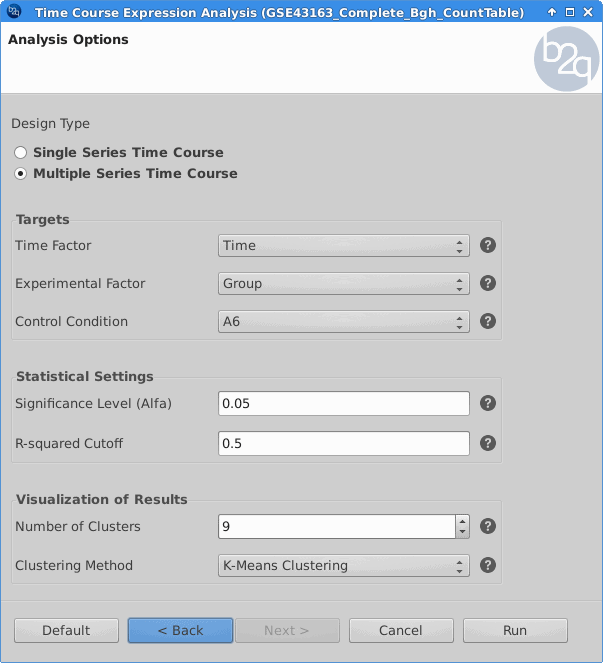
- On the “Analysis Options” page of the main wizard, users can adjust the parameters for the statistical test.
|
 |
Results
After the analysis, interpretation of results is important to reach biological conclusions.
|
maSigPro:
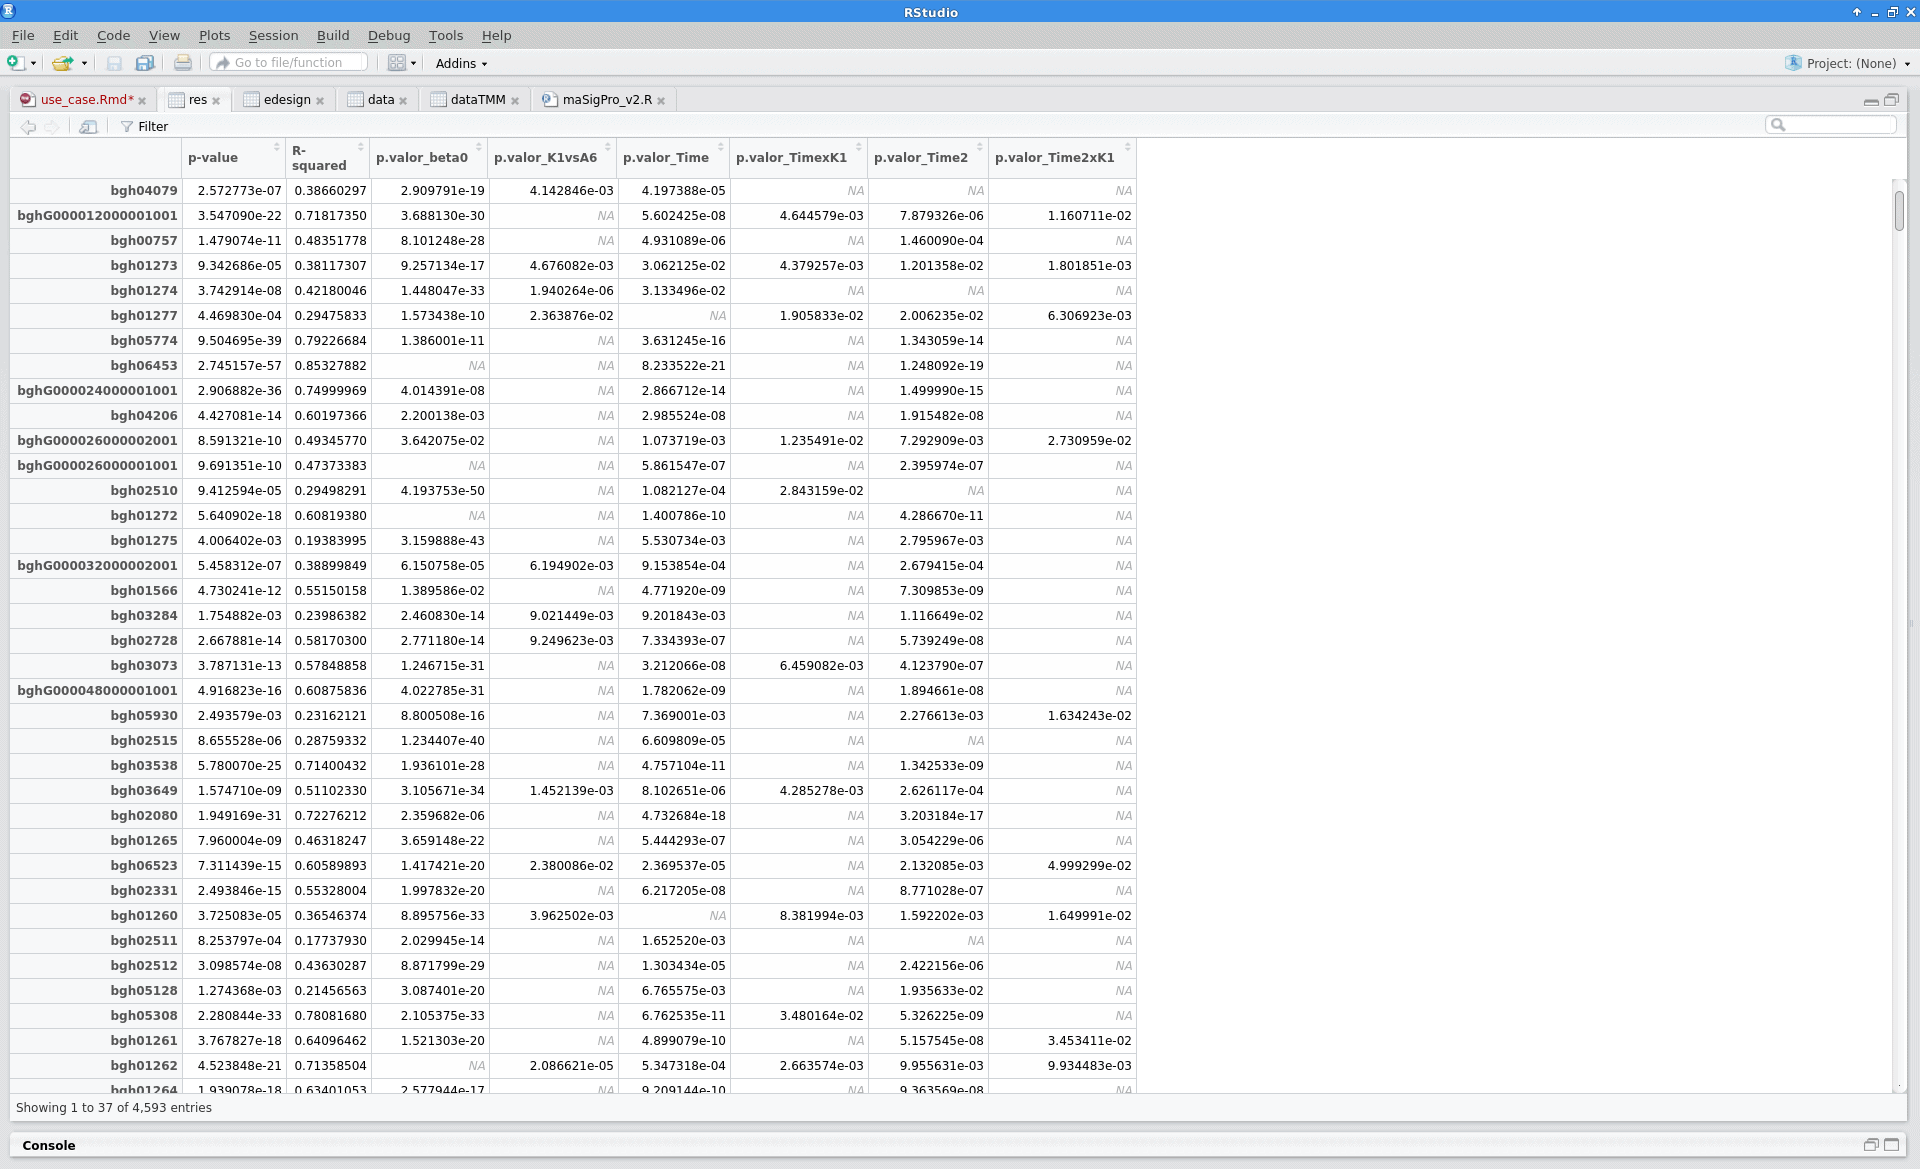
- The element sol (which can be extracted from the “tstep” object) is a matrix of statistical results obtained by the stepwise regression.
|
tstep$sol
 |
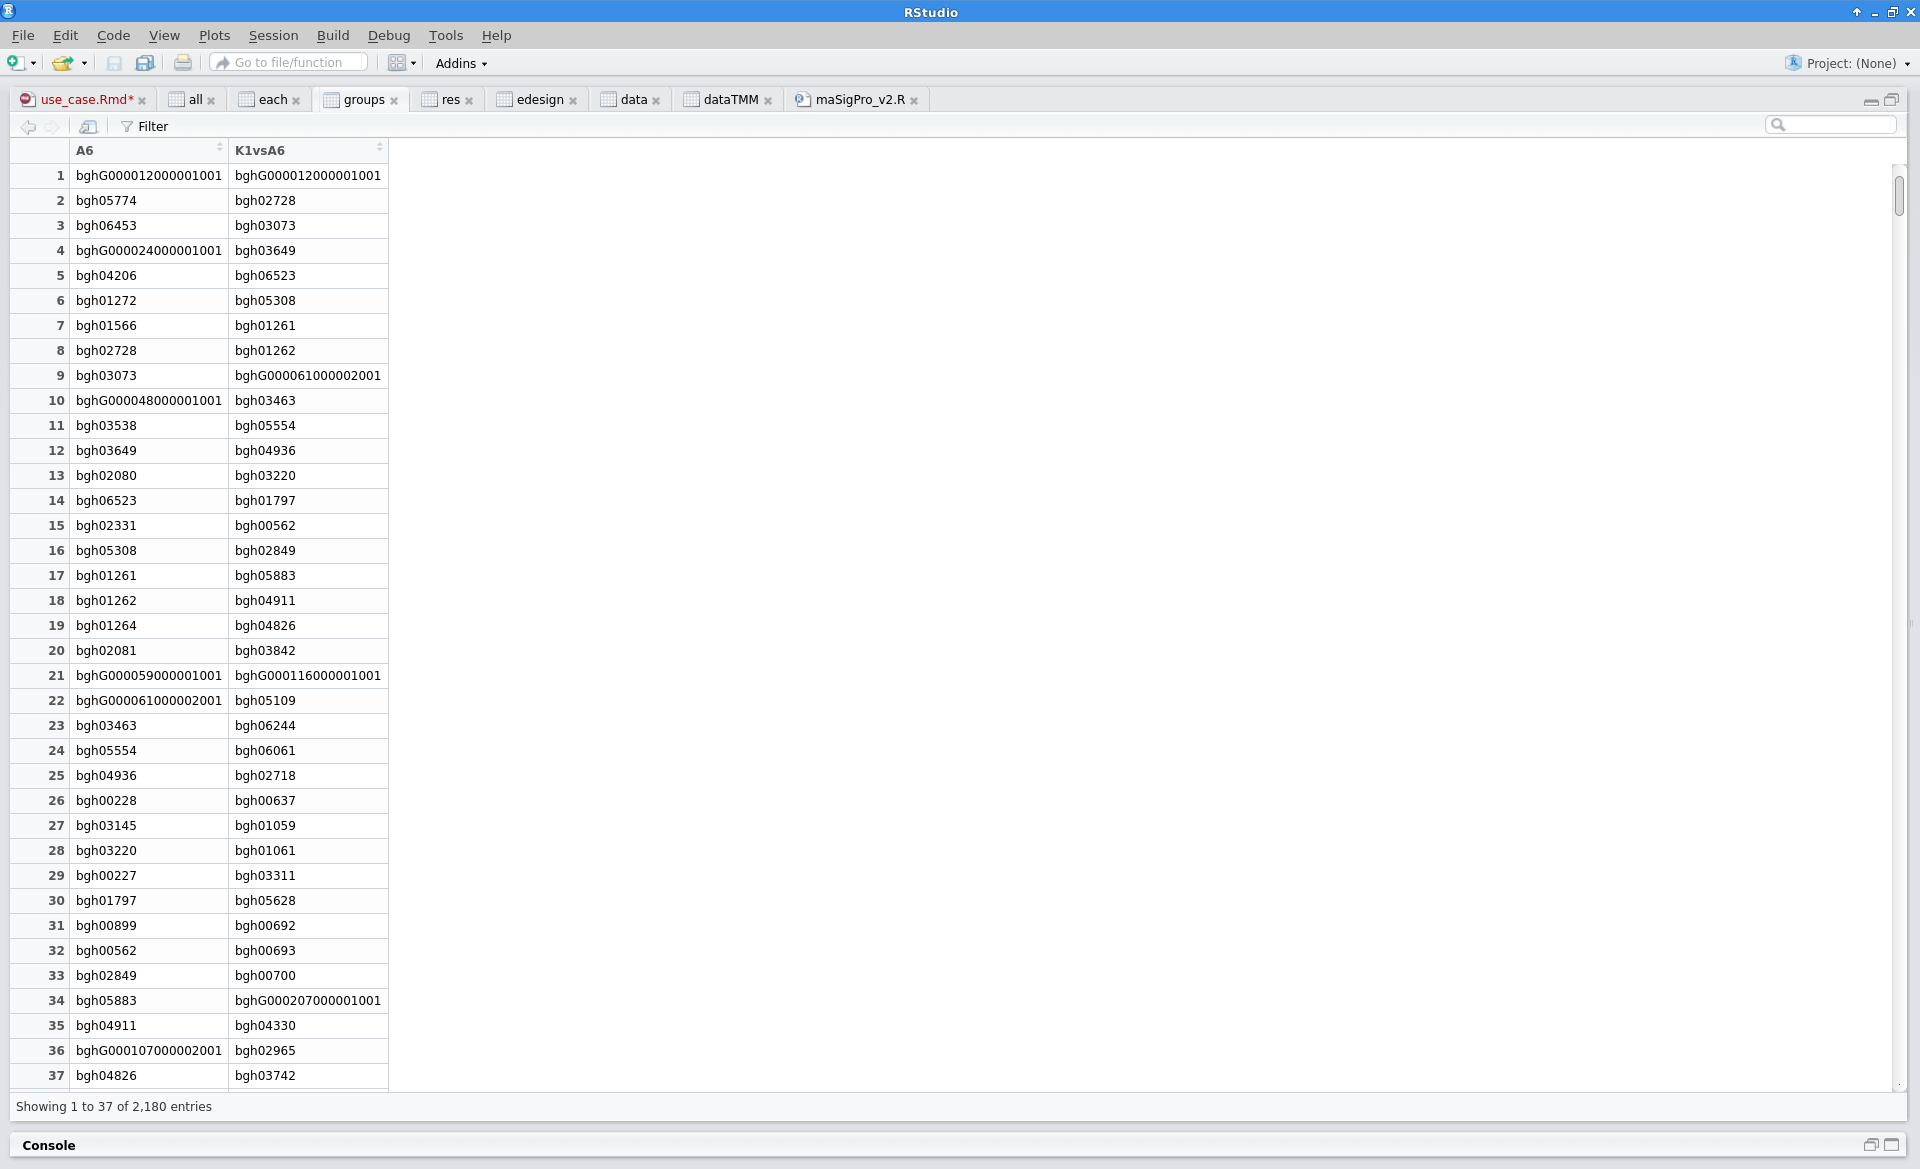
- The element summary (which can be extracted from the “sigs” objects) is a data frame containing the significant genes for the selected vars (“all”, “groups” and “each”)
|
sigs.group$summary
|
|
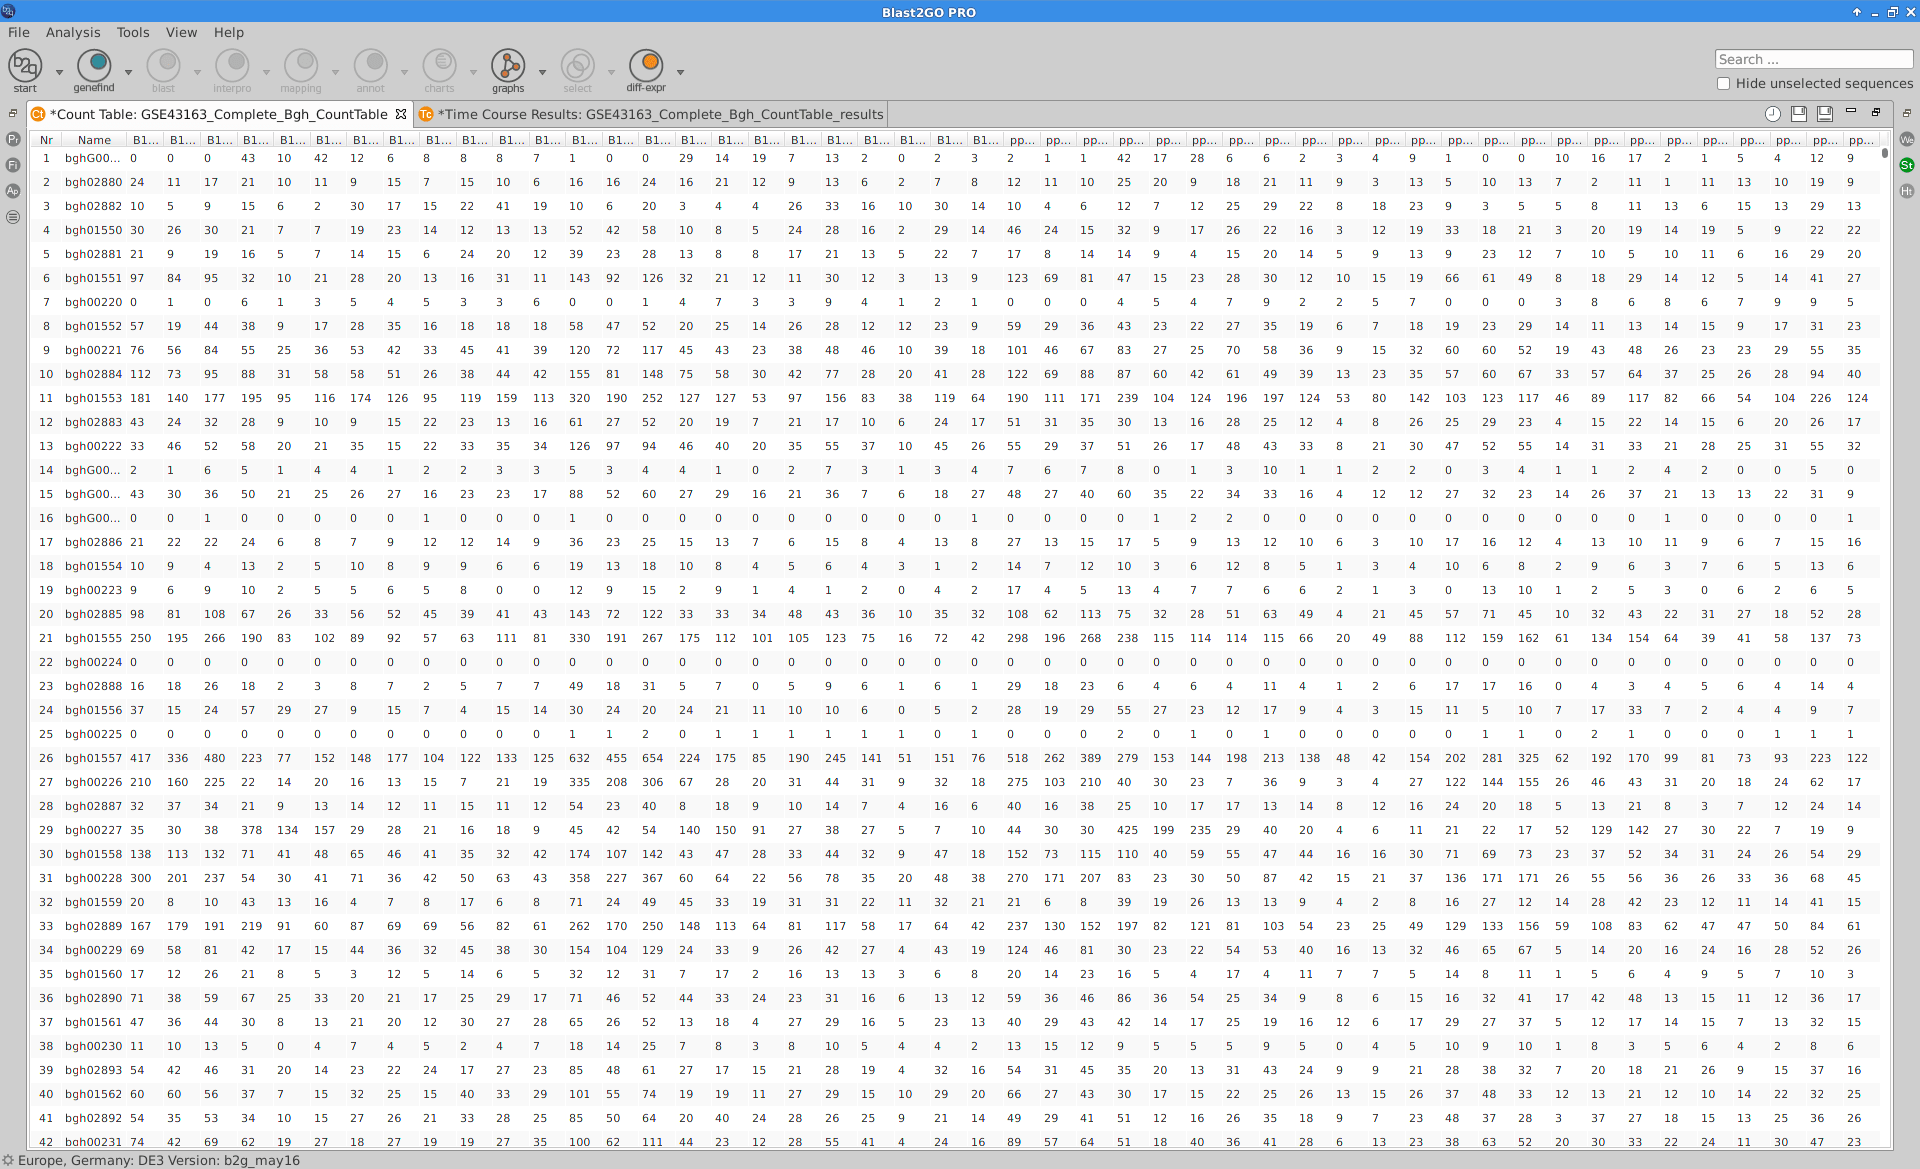
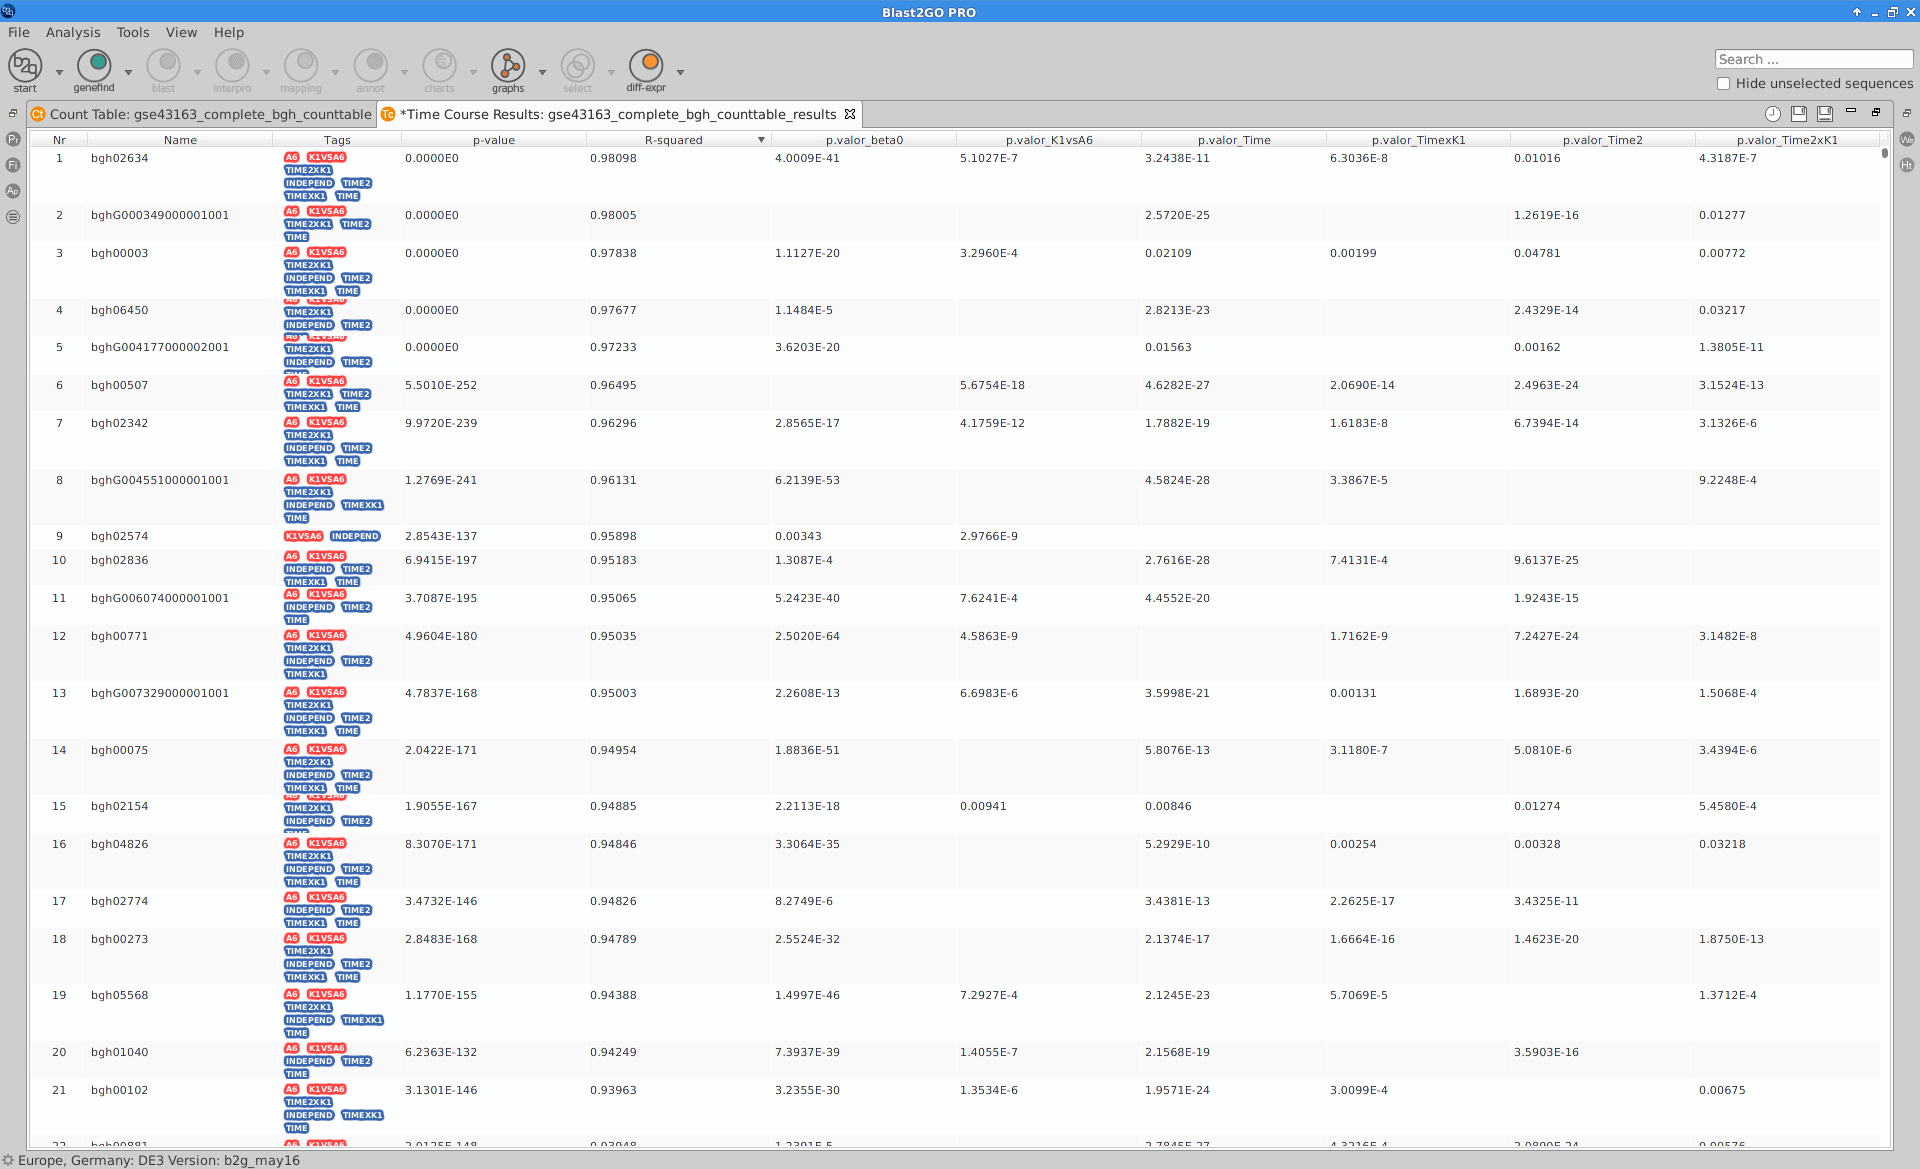
Blast2GO:
- Once the input counts has been processed and analyzed, results will be displayed on the Main Generic Table Viewer.
|
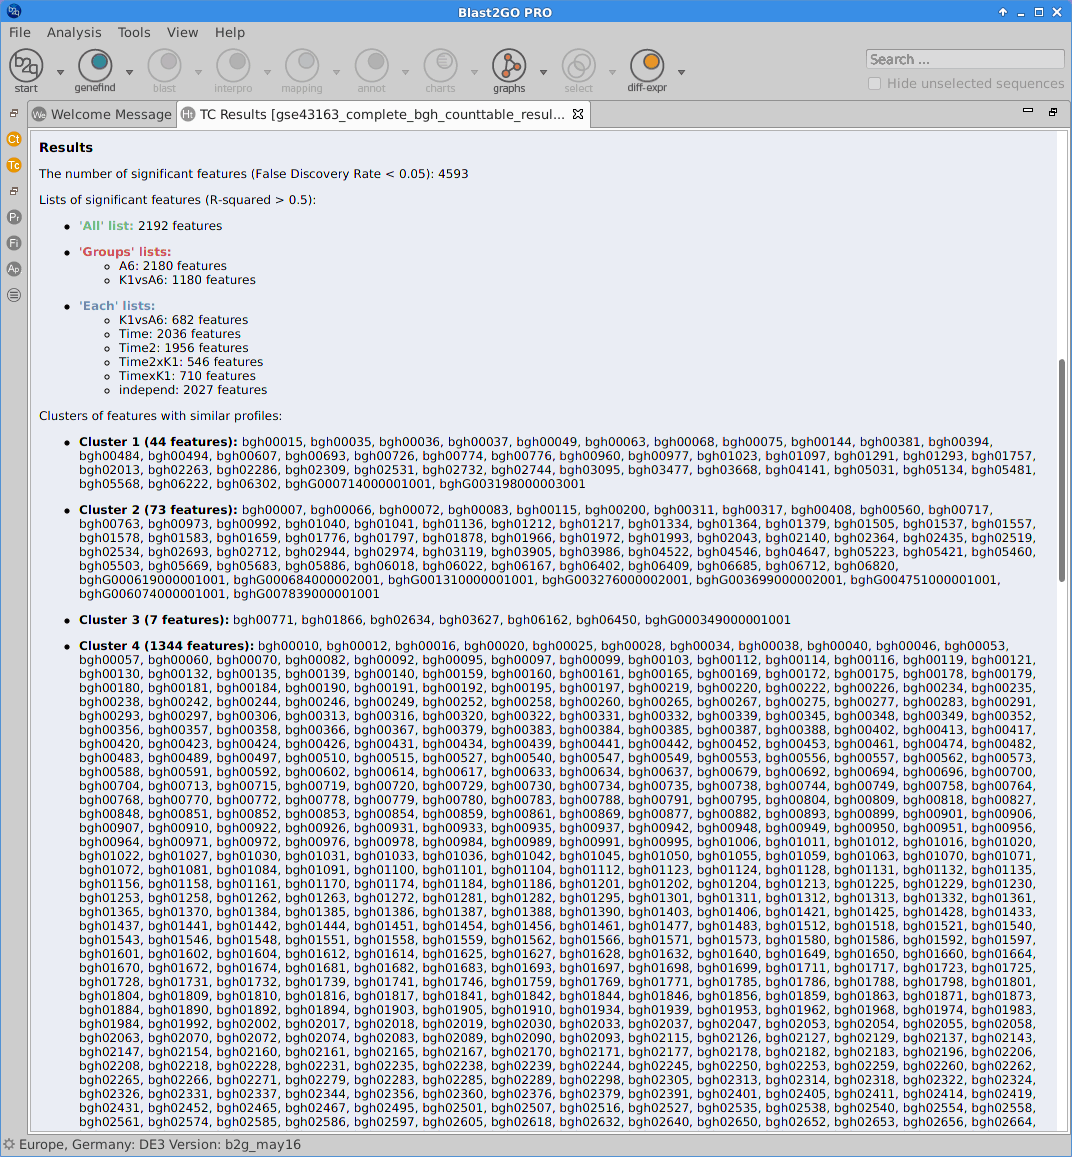
 |
- A result page show a summary of the time course expression analysis results, including the cluster of features with similar expression profiles.
|
 |
Statistics
Different statistics charts can be generated for a global visualization of the results.
-
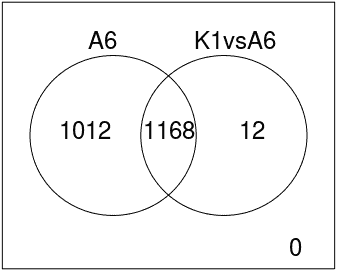
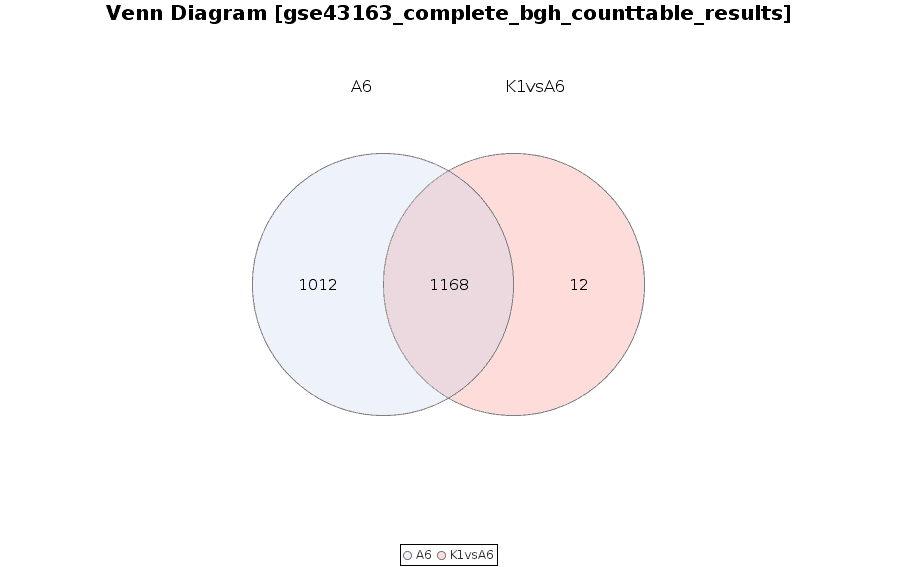
Venn Diagram
Diagram that shows all possible logical relations between a finite collection of different feature sets.
|
maSigPro:
|
suma2Venn(sigs.group$summary)
 |
|
Blast2GO:
- Diff Exp → View Results: Time Course Analysis → Statistics → Venn Diagram.
|
 |
-
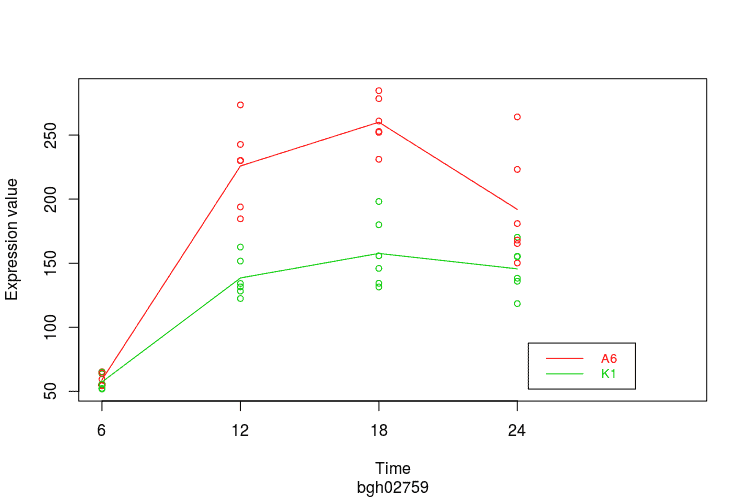
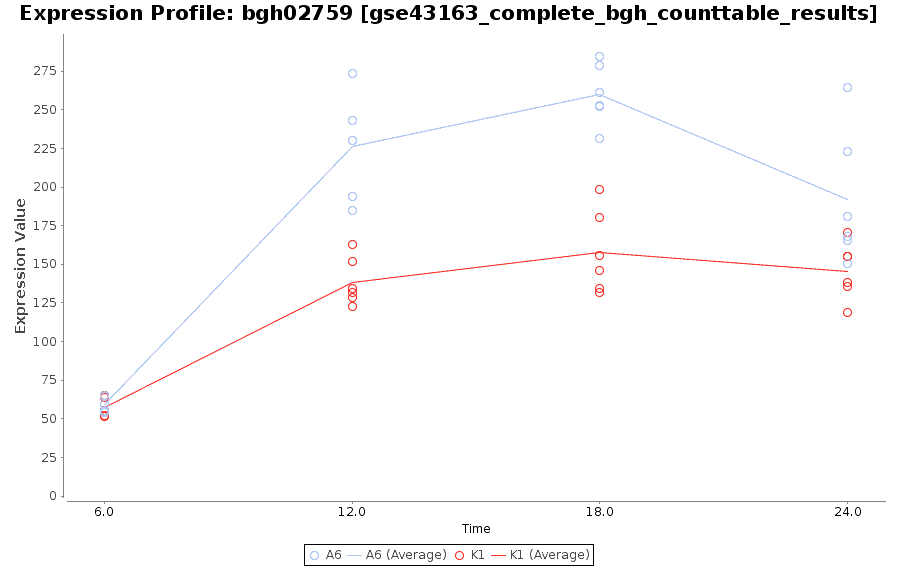
Expression Profile by Gene
Graph of gene expression profiles over time for a particular feature.
|
maSigPro:
|
gene <- normalizedData[
        rownames(normalizedData)=="bgh02759",]
PlotGroups(gene, edesign=edesign)
 |
|
Blast2GO:
- Right-clicking on the chosen gene and selecting the “Show Expression Profile option.
|
 |
-
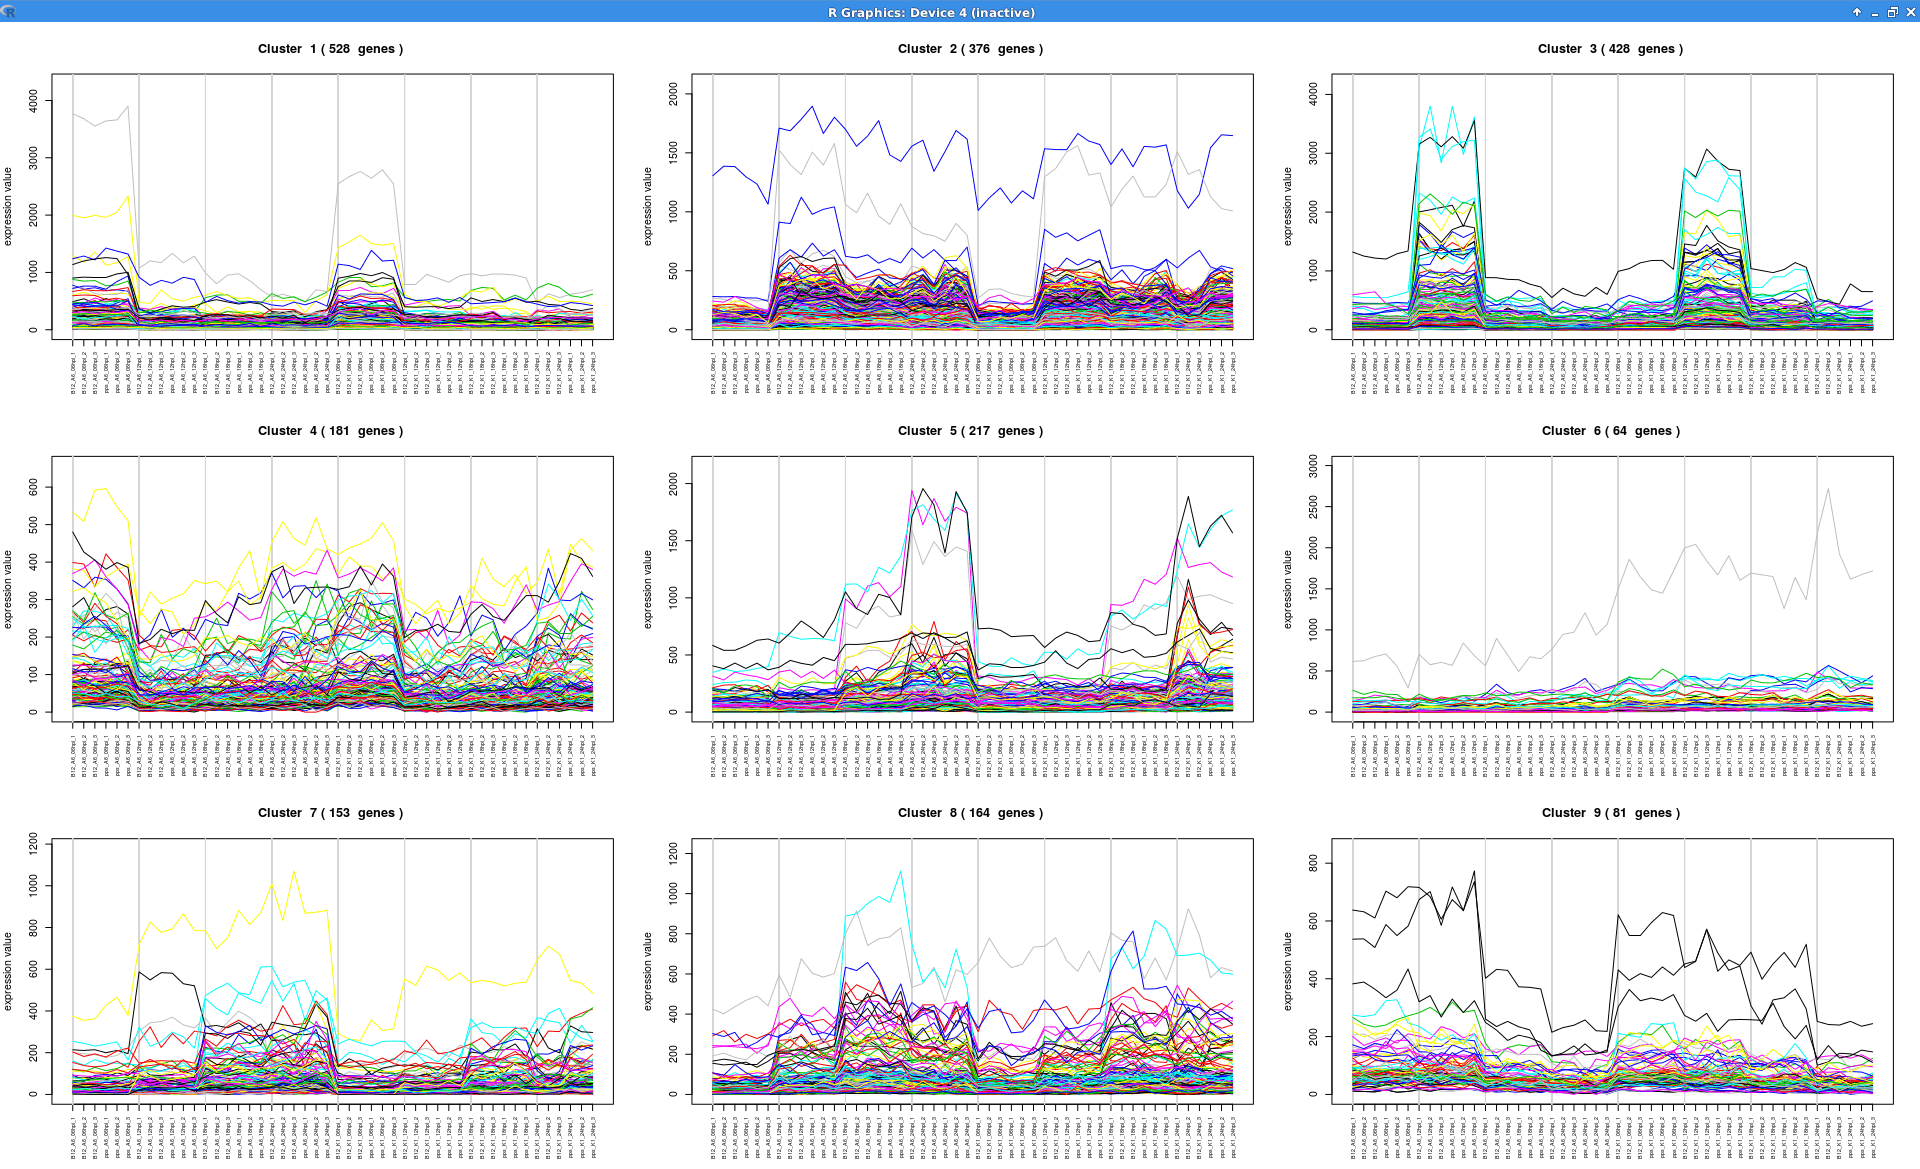
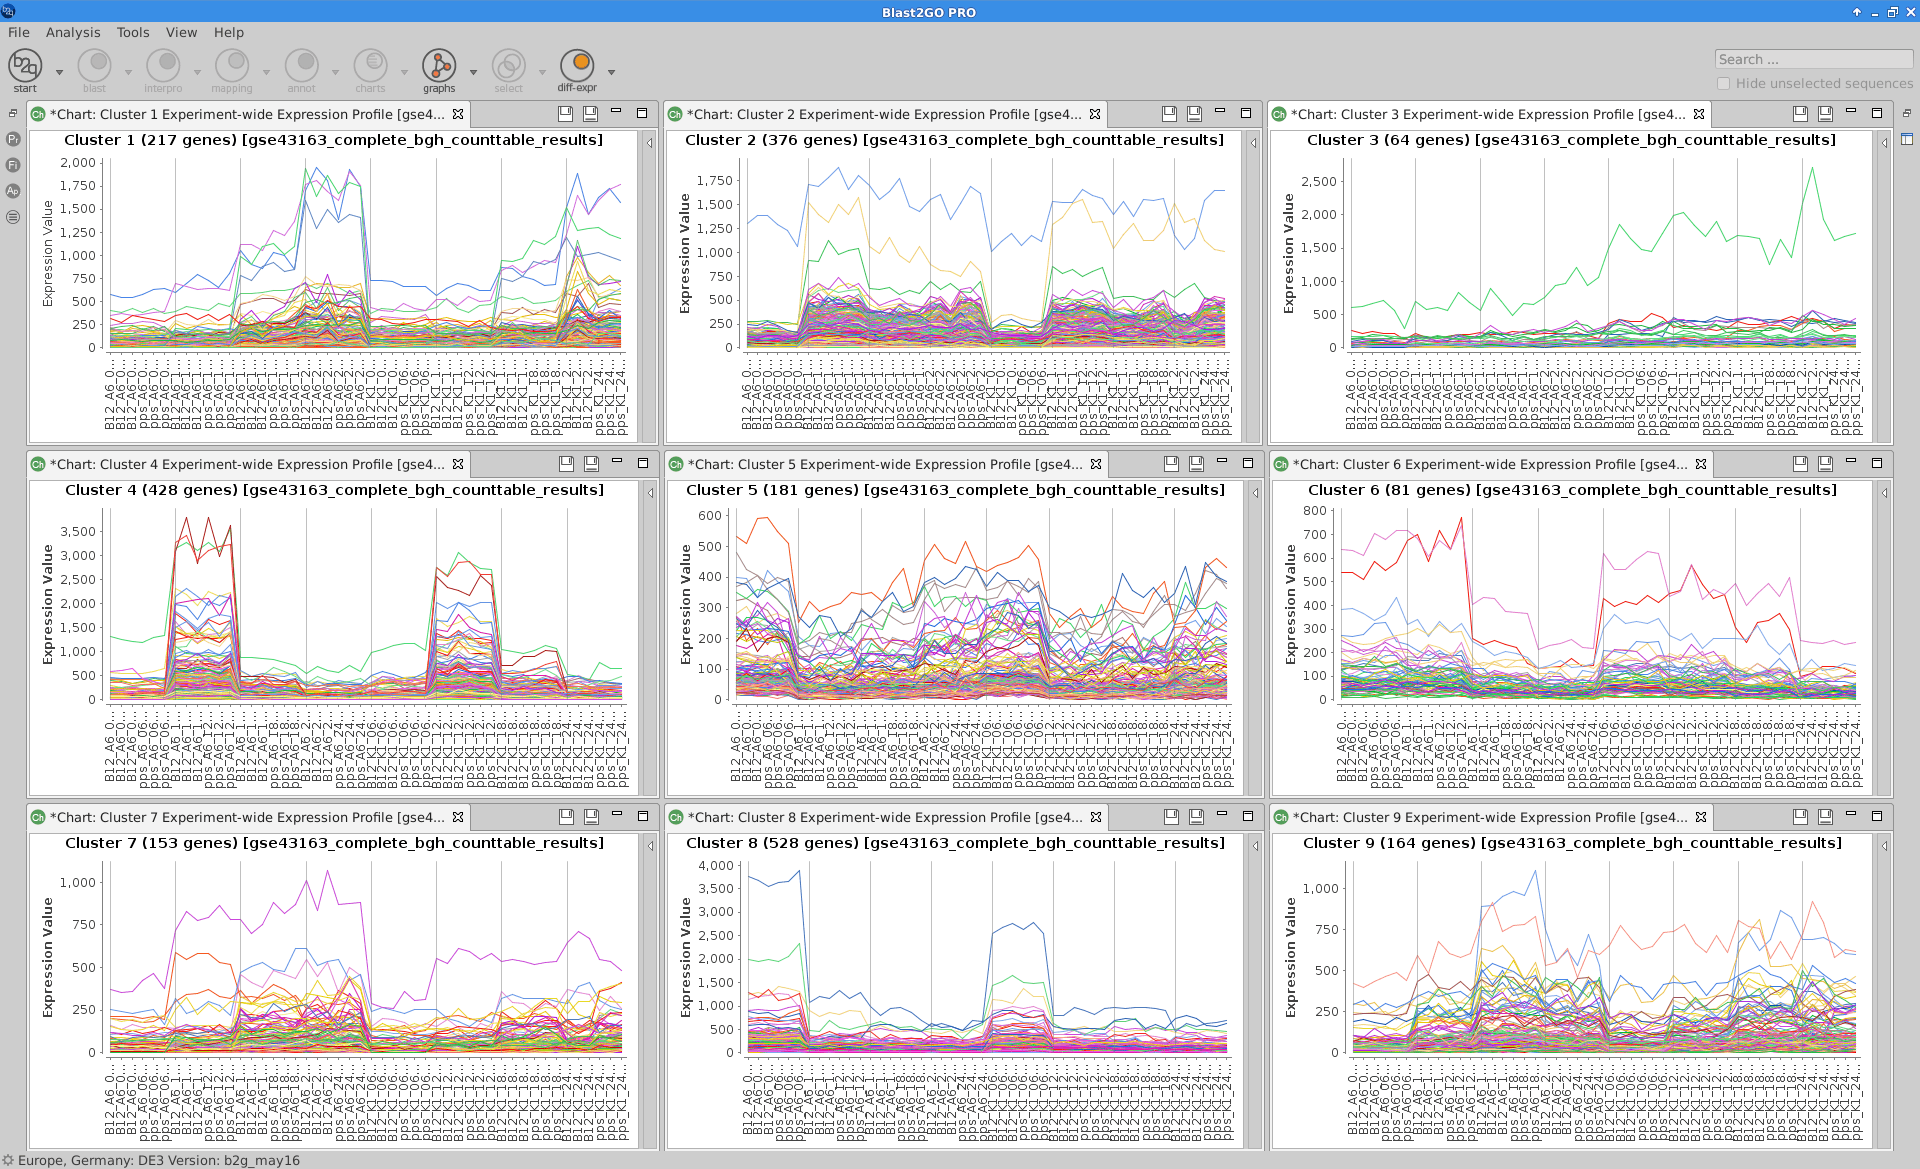
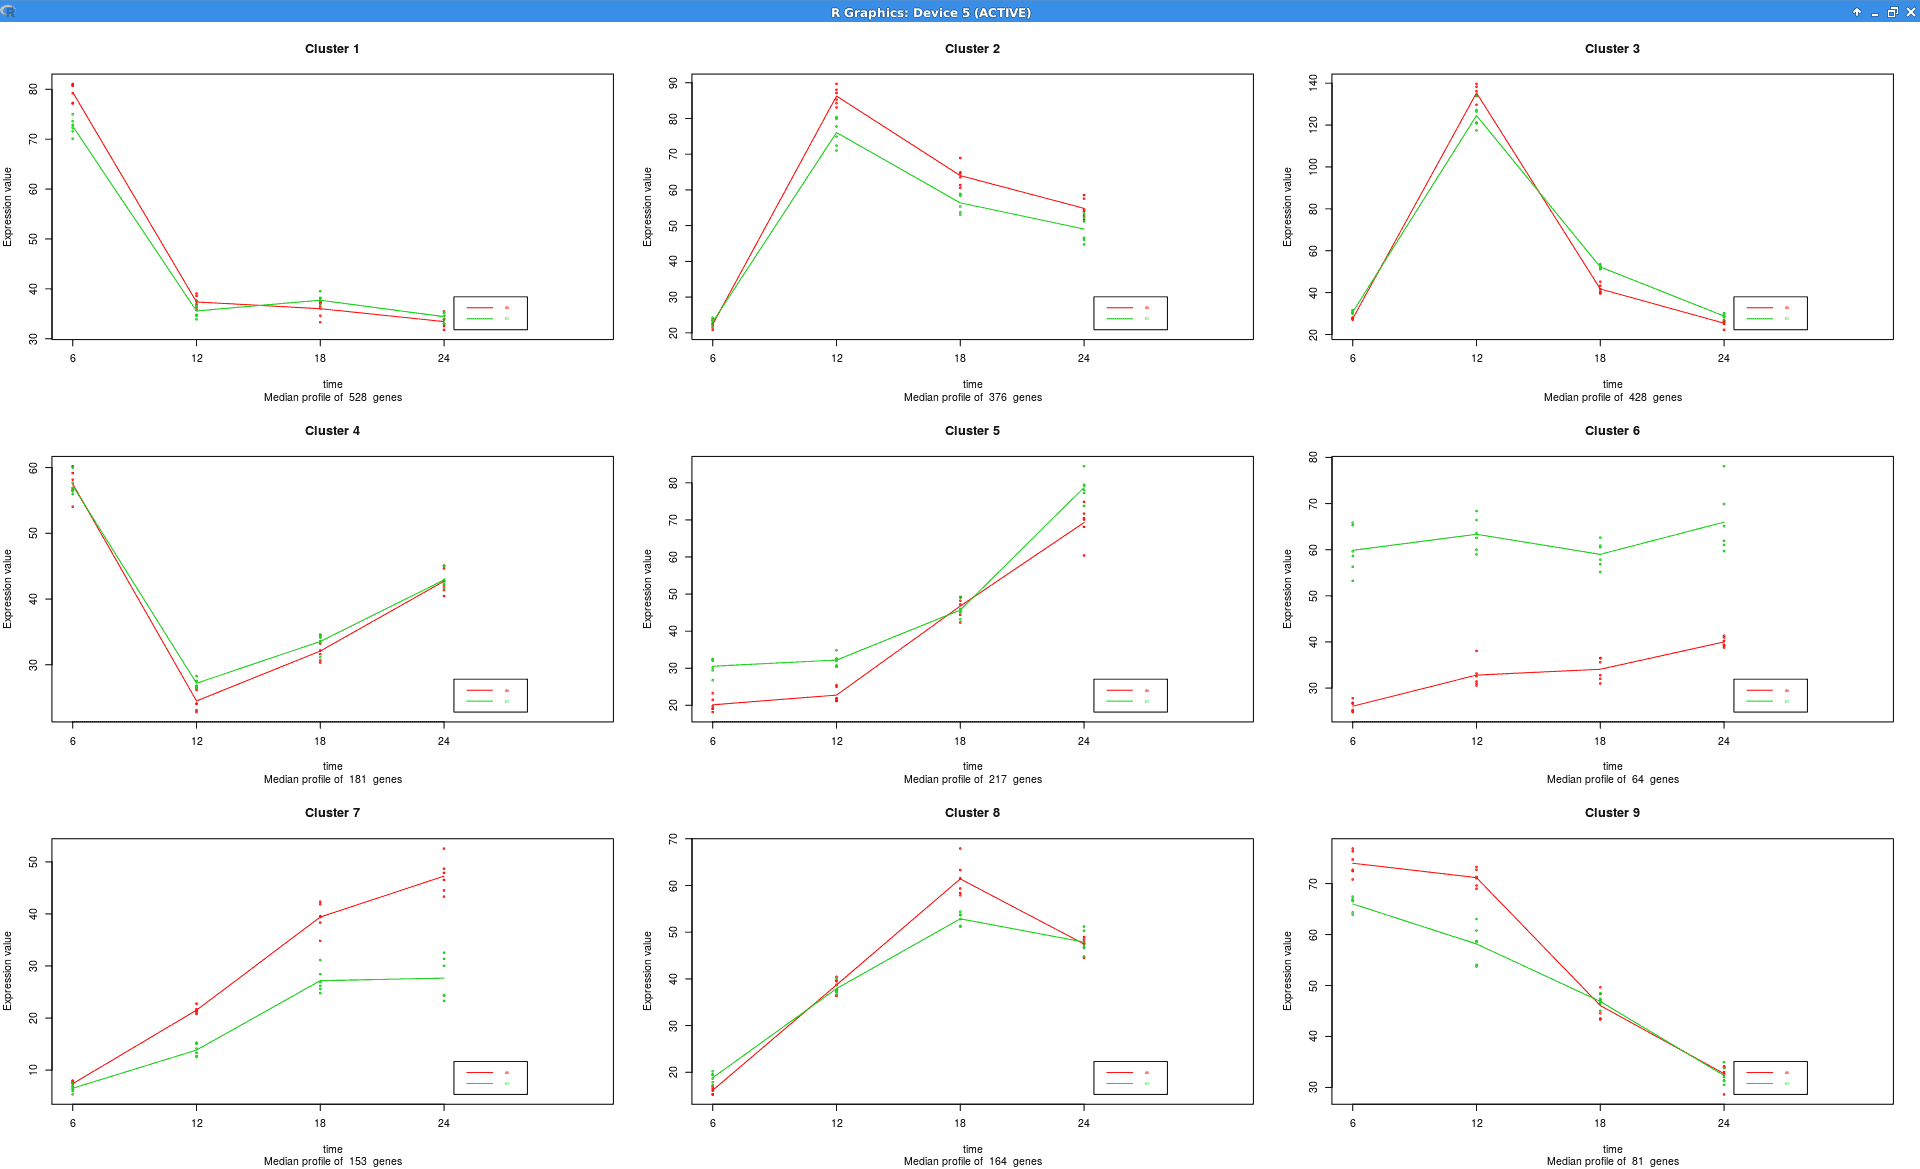
Experiment-wide Expression Profiles
Plot that shows the expression levels across samples for each cluster of genes.
|
maSigPro:
|
see.genes(sigs.all$sig.genes, min.obs=7,
        cluster.method="hclust",
        cluster.data=1, k=9)
|
|
Blast2GO:
- Diff Exp → View Results: Time Course Analysis → Statistics → Expression Profiles (“Experiment-wide Expression Profiles” option).
|
 |
-
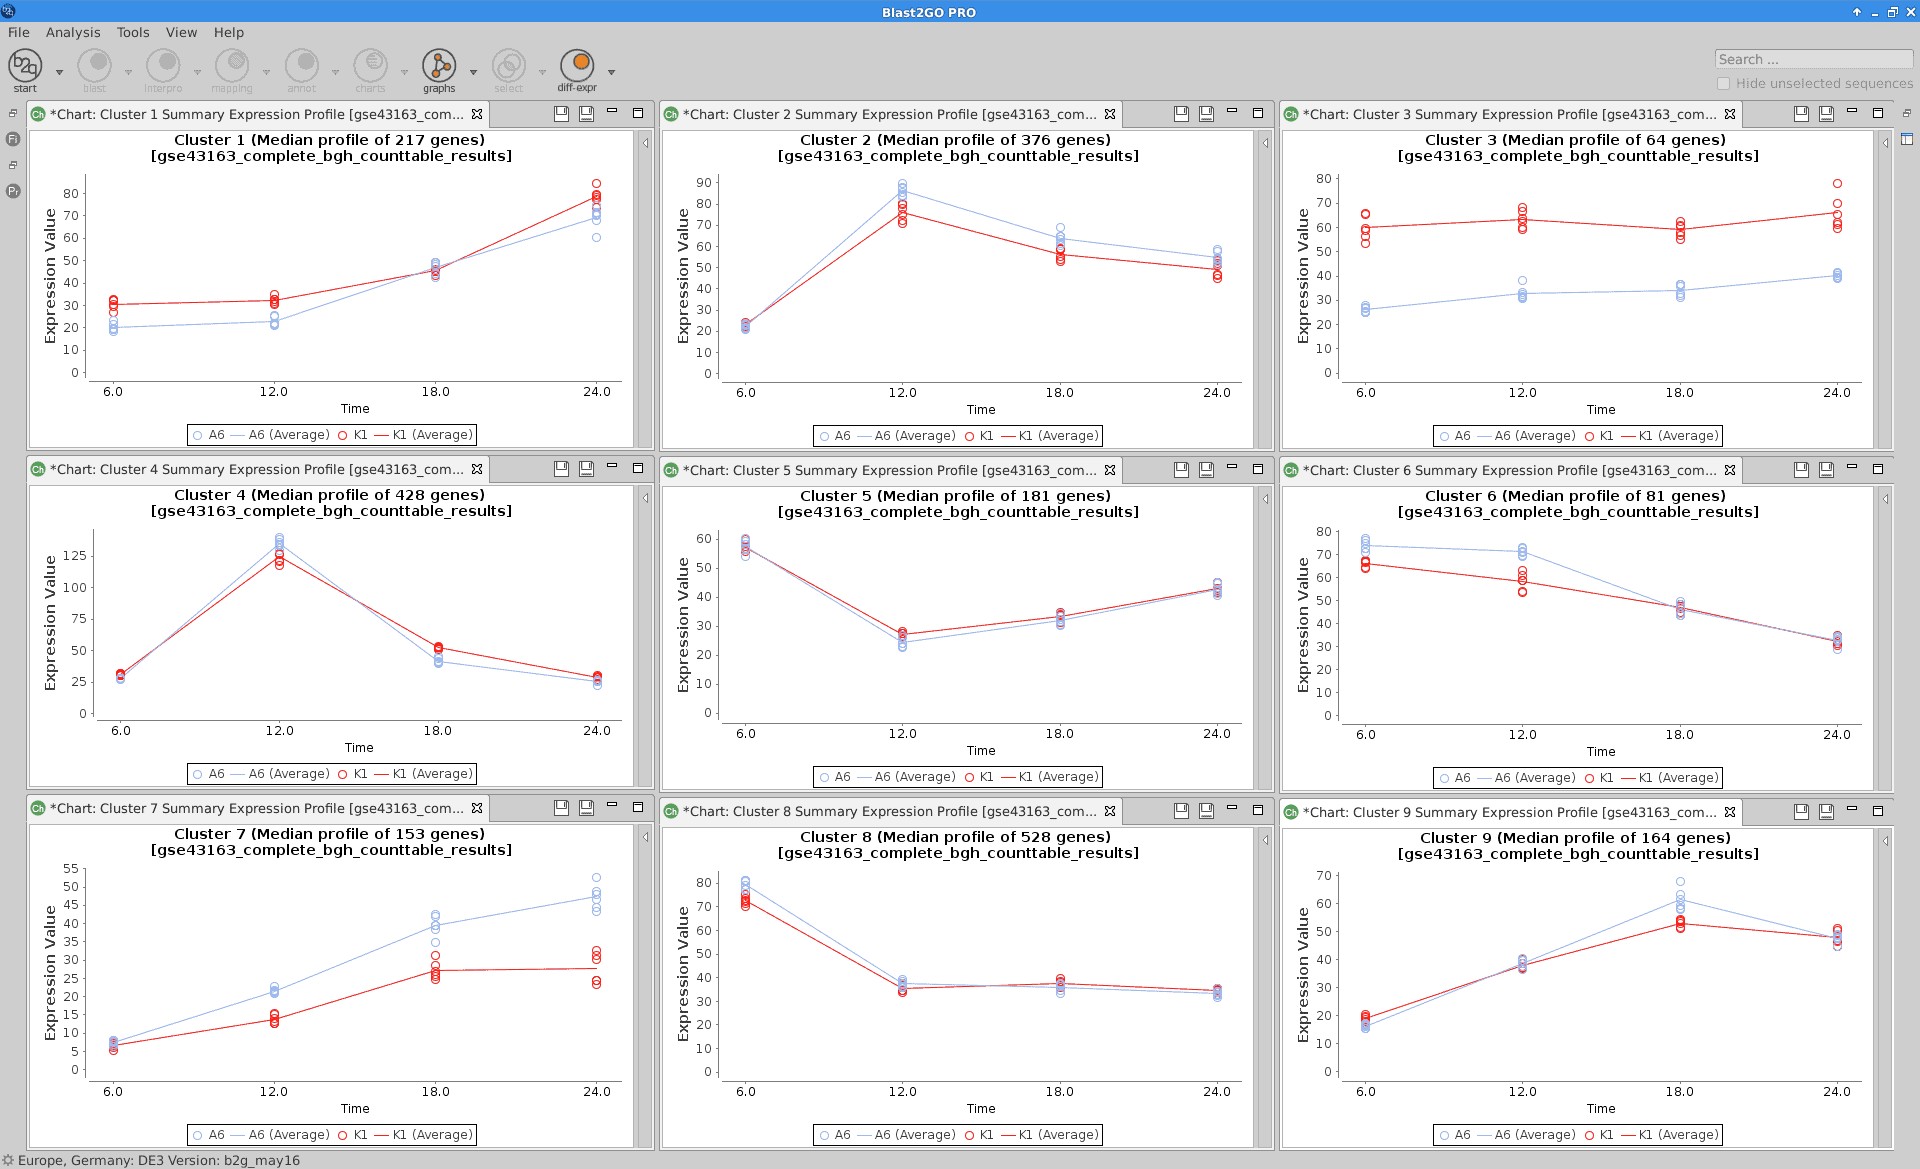
Summary Expression Profiles
Plot that shows the median level expression of each cluster of genes across time.
|
maSigPro:
|
see.genes(sigs.all$sig.genes, min.obs=7,
        cluster.method="hclust",
        cluster.data=1, k=9)
 |
|
Blast2GO:
- Diff Exp → View Results: Time Course Analysis → Statistics → Expression Profiles (Summary Expression Profiles” option).
|
 |
Conclusions
As shown in this use case, the maSigPro package is a powerful tool that allows statistical analysis for RNA-seq technology data from time course experiments. The Blast2GO feature “Time Course Expression Analysis” uses all the maSigPro statistical potential to offer an easy and simple way to perform this type of analysis, without requiring programming skills. Furthermore, users can take advantage of Blast2GO features to complete the analysis and achieve greater understanding of the biological problem that is being studied.
References:
Nueda MJ, Tarazona S and Conesa A (2014). “Next maSigPro: updating maSigPro bioconductor package for RNA-seq time series.” Bioinformatics, 30, p. 2598–2602.

