What is scRNA-Seq Quantification?
The first step for any Single-cell RNA-Seq analysis is to perform the quantification or, in other words, to obtain the gene expression values by cell. It is the input data for further analysis like Clustering, Trajectory, Cell-Cell Communication, Differential Expression, etc. Briefly, in order to obtain the expression values the sequencing reads are aligned to a reference genome or transcriptome and counted by the genes annotated in the reference GTF or GFF. Finally, counts must be “demultiplexed” or assigned to the corresponding cell of origin. This step can be very tricky since it heavily depends on the structure of the read generated by the Library Preparation technology used for sequencing.
What is the difference between Full-length and 3’/5′ Enrichment technologies?
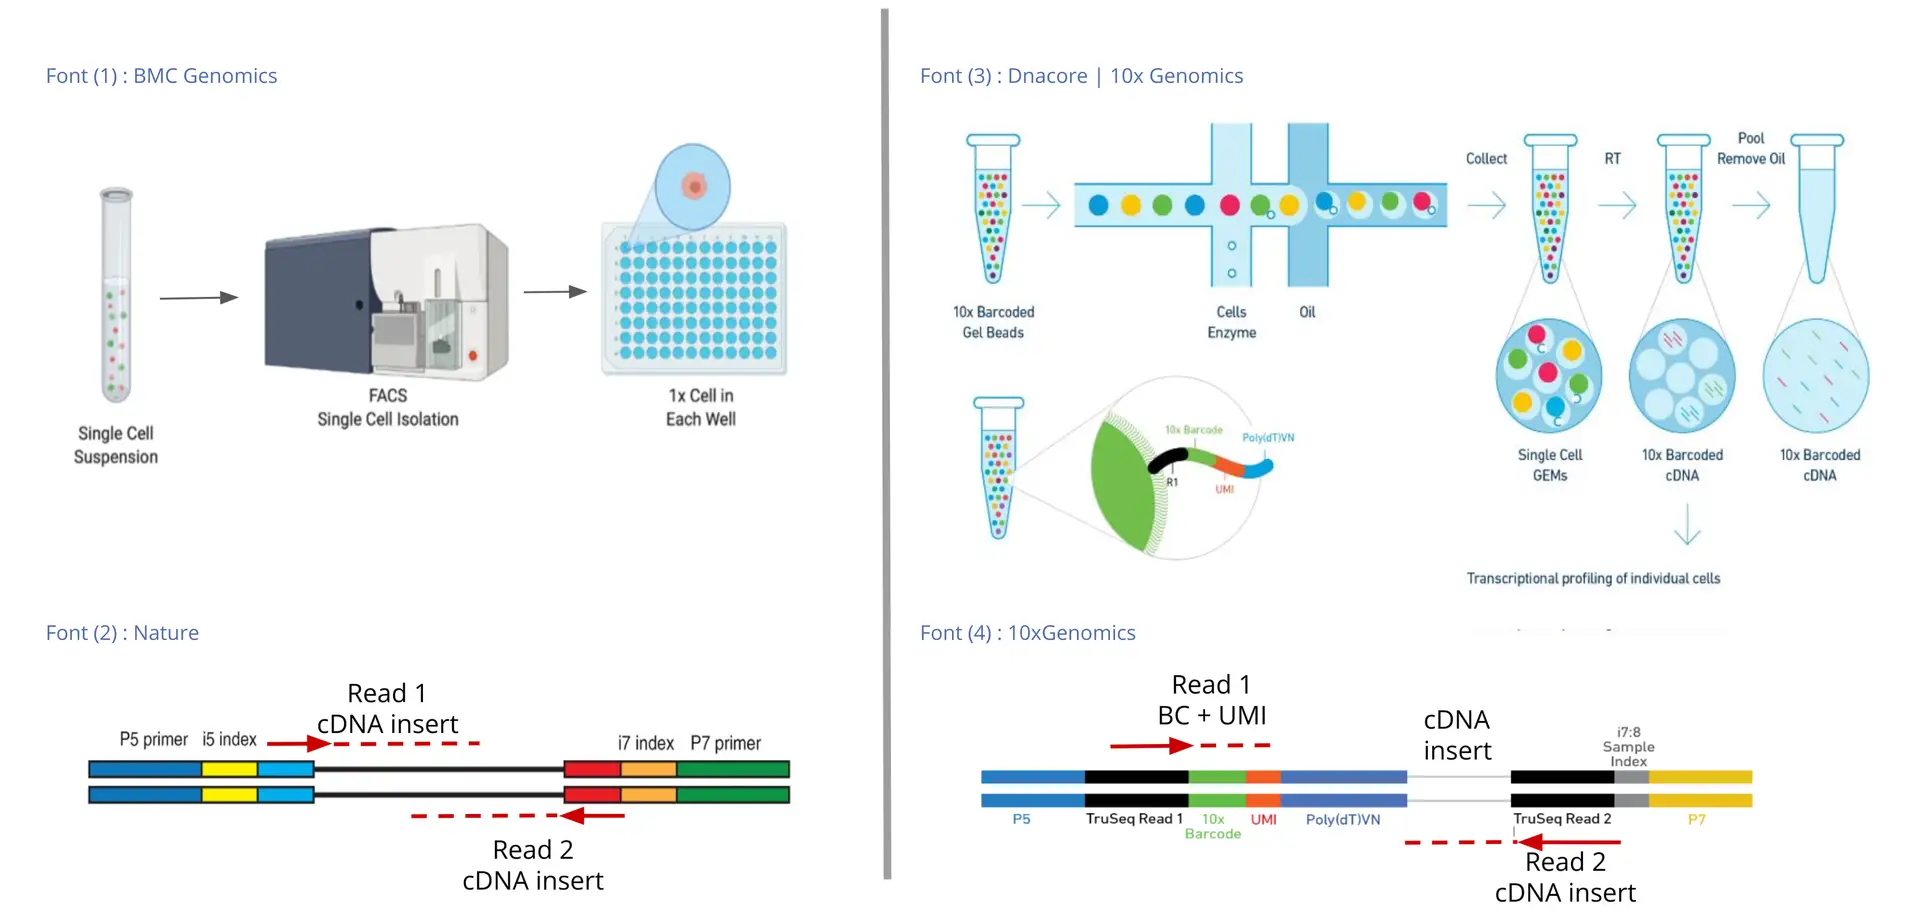
There are two main groups of Single-cell Library Preparation technologies: the Full-length and the 3’/5′ Enrichment or Barcoded technologies. Examples of the first group of technologies are SMART-Seq (Picelli S, 2014) and SMARTer (Verboom K, 2019). They are called Full-length because the transcript is sequenced from both ends, so both sequencing reads (the upstream and the downstream read) contain actual cDNA sequences. This is possible because cells are isolated previously on a plate, so the library preparation and the sequencing take place for each of the cells separately.
On the other hand, in Barcoded technologies, the library preparation takes place separately for each cell in emulsion droplets, but after this, all the cells are sequenced simultaneously. Thus, to later identify the cell of origin of each of the reads, they have to be tagged with a Cell Barcode (CB), which is unique for each cell. In addition to Cell Barcodes, each RNA molecule is tagged with a specific Unique Molecular Identifier (UMI), which helps correct for sequencing amplification bias. Thus, each transcript will be tagged with a Cell Barcode and a UMI, which will be added to the 3′ or the 5′ end (depending on the library preparation technology). Therefore, in Barcoded technologies one read will contain the Cell Barcode and the UMI sequences and the other read will contain the cDNA sequence.
Since the transcript will be sequenced only from one end, these types of technologies are called 3′ Enrichment or 5′ Enrichment. Examples are 10x Chromium (Zheng G, 2017), Drop-seq (Macosko E, 2015), CEL-Seq2 (Yanai I, 2019), MARS-Seq2 (Keren-Shaul H, 2019), etc.
Thus, the key differences between the Full-length and the 3’/5′ Enrichment technologies are:
Full-length
- Low throughput. Hundreds or a few thousands of cells.
- No use of Cell Barcode nor UMI.
- Longer cDNA sequences.
- Suitable for isoform analysis.
3’/5′ Enrichment
- High throughput. Tens and even hundreds of thousands of cells.
- Use of Cell Barcode and UMI.
- Shorter cDNA sequences and biased towards the 3′ or 5′ end.
- Suitable for studying the gene expression at cell-type resolution.
The main challenge to performing scRNA-Seq quantification is that each Library Preparation produces a different read structure. Not only there is a difference between the Full-length and the 3’/5′ Enrichment, but the different 3’/5′ Enrichment protocols use Cell Barcodes and UMIs of different lengths. On this matter, STARsolo (Kaminow B, 2021) comes in very handy, since it provides different parameters to specify the read structure, making it very flexible and adaptable to most Library Preparation technologies. In addition, it has been assessed in different benchmarking papers that it has a high sensitivity and speed in comparison with other scRNA-Seq quantification tools (Brüning RS, 2022). In addition, it provides many different options to tune the behavior of the algorithm and adapt it to the data.
STARsolo Pipeline
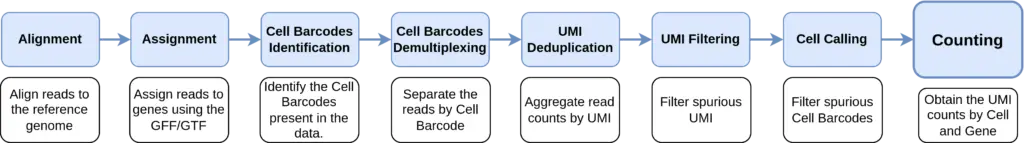
In order to perform the scRNA-Seq Quantification from 3’/5′ Enrichment (or Barcoded) sequencing data, STARsolo performs the following steps to take into account both Cell Barcodes and UMIs:
In addition, it is possible to select different algorithms for each of the above-mentioned steps, making the quantification highly customizable.
For Full-length data, the pipeline is simpler. Since these types of technologies produce one FASTQ file per cell, there is no need for Cell Barcode detection, demultiplexing, etc. The pipeline only consists of the alignment of the reads, the assignment of reads to genes, and counting.
STARsolo Implementation in OmicsBox
Since OmicsBox v.3.1, all these STARsolo features are implemented in the Single-cell RNA-Seq Quantification tool, which allows easy customization of the quantification.
Suitable for most 3’/5′ Enrichment technologies
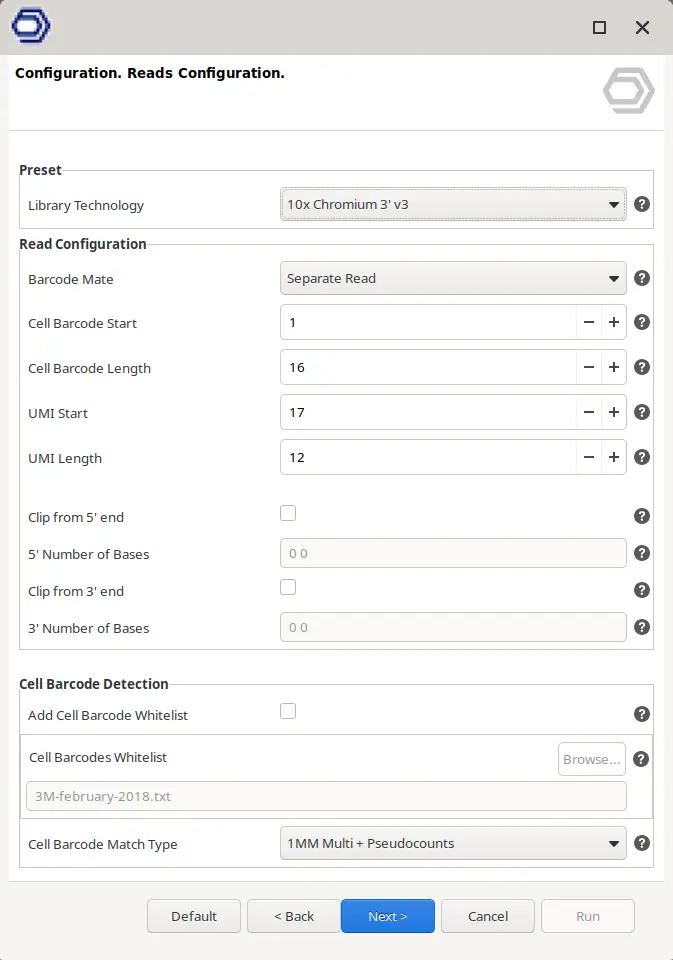
For 3’/5′ Enrichment technologies, there is a whole wizard page to specify the geometry of the reads (Figure 3). Here it is possible to select the starting position in the reads and the length in basepairs for both Cell Barcodes and UMIs. It is useful since different Library Preparation technologies use different lengths. For example, Drop-seq uses a Cell Barcode of 12bp and a UMI of 8bp whereas 10x Chromium 3′ v3 uses a Cell Barcode of 16bp and a UMI of 12bp.
In addition, the most common scenario is that there is one read composed exclusively of CB and UMI and another with the cDNA sequence. However, in some technologies like 10x Chromium 5′ the read containing the CB and the UMI also contains cDNA sequence. In this case, it is interesting to clip the cDNA sequence from the read in order to both clean the barcodes and keep the cDNA sequence for alignment. In this scenario, it is possible to choose the read containing the barcodes with the “Barcode Mate” parameter, and whether to clip bases from the 3′ or the 5′ end and the number of bases.
The information about the structure of the reads usually is provided by the sequencing facility or by the protocol guidelines. Anyway, a member from the Teichman’s Group has written useful documentation about the procedures and the read structure of many different Library Preparation technologies (Single Cell Genomics Library Structure). For simplicity, preset options are available at the top of the wizard page for the most common technologies. When one of the options is selected, all the parameters in the wizard are updated accordingly.
Highly Customization
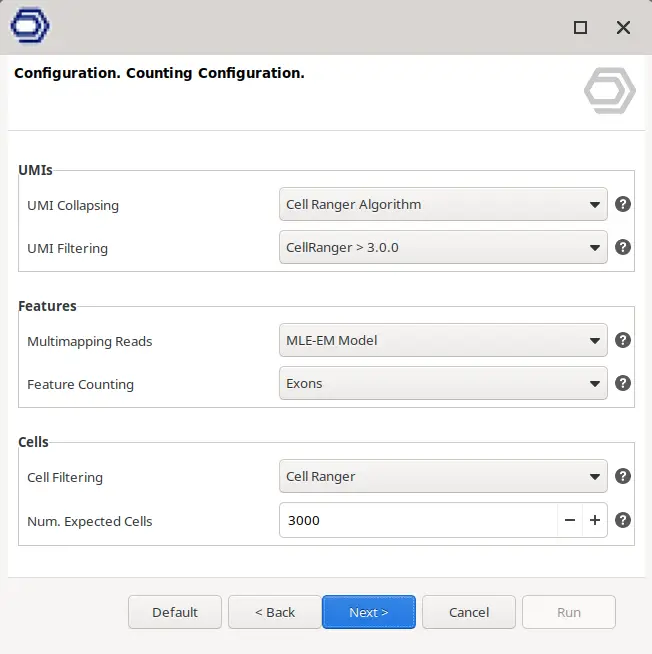
It is possible to decide the behavior of the algorithm for almost all of the steps in the STARsolo pipeline (Figure 2). A more detailed description of each of the algorithms can be found in the OmixsBox User Manual.
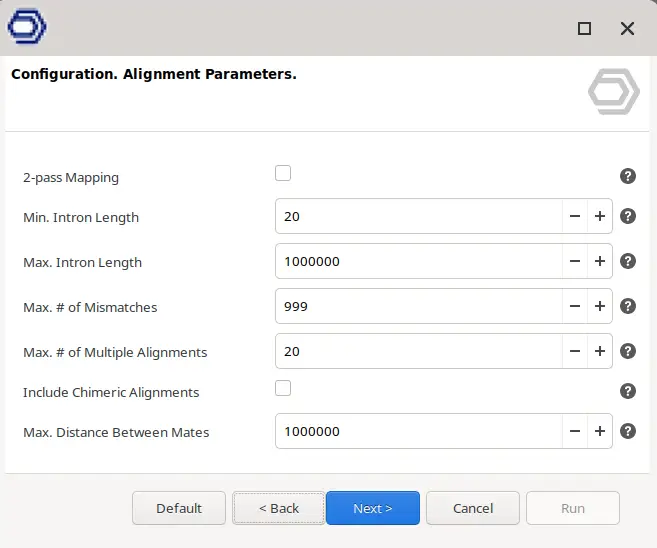
- Alignment. This step maps the reads containing cDNA sequences to the reference genome. There are different parameters to refine the alignment step (Figure 4).
- Cell Barcodes Identification. The identification of the different Cell Barcodes can be automatically inferred from the data or can be based on a whitelist. In the latter, it is possible to decide the algorithm to match the Cell Barcodes identified in the reads with the ones in the whitelist with the “Cell Barcode Match Type” parameter (Figure 3).
- UMI Deduplication. The reads with the same UMIs are counted together, that is, in order to obtain a gene’s level expression the number of different mapped UMIs is counted, instead of the number of reads. During sequencing, errors may be introduced in UMIs sequences, causing them to be counted separately. In order to avoid this, there are different algorithms to try to collapse UMIs with slightly different sequences that may have originated from the same molecule. The behavior of this step can be chosen in the “UMI Collapsing” parameter (Figure 5).
- UMI Filtering. Even after the collapsing step, there may be still remaining UMIs with bad quality sequences, with very few reads assigned or with reads mapping to different genes. These bad-quality UMIs may interfere with the results so it may be desirable to filter them. Again, many different behaviors can be selected with the “UMI Filtering” parameter.
- Cell Calling. This step aims to identify “rea or orl” cells in front of empty droplets with ambient RNA within all the Cell Barcodes detected. Different behaviors can be selected in the “Cell Filtering” parameter (Figure 5).
- Counting. It is possible to select which reads to use for the final gene-cell counting: whether to discard or use multi-mapping reads and whether to count reads mapping only to exon parts of the gene or both exon and intron. This can be modified in the “Multimapping Reads” and “Feature Counting” parameters, respectively.
This allows for more control in the behavior of the counting algorithm, as opposed to other algorithms that provide default options with strong assumptions and impact on the final count matrix (Probst V, 2022). For example, CellRanger discards the multi-mapping reads and only counts reads mapping to exonic regions by default and it is not possible to modify this behavior, which greatly reduces the number of reads used for counting. However, depending on the input data it may still be desirable to account for these reads.
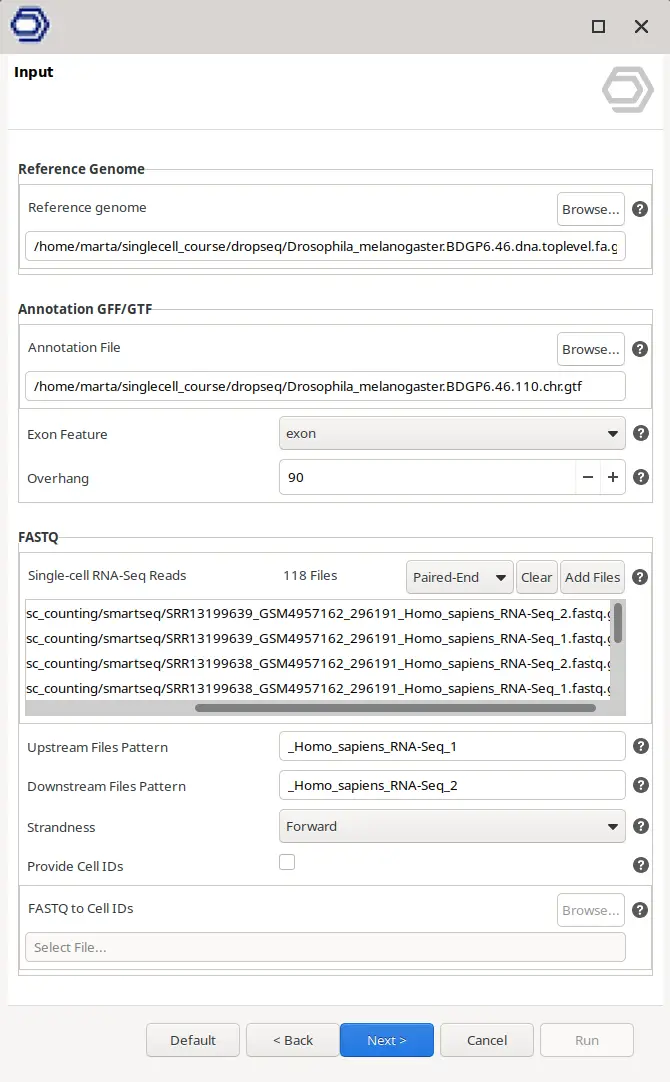
Suitable for Full-length technologies
For this type of data, there is no need to specify Cell Barcodes, UMI structure, or all the behavior of the above-mentioned steps. It is only necessary to provide the FASTQ of all the cells and, if wanted, a text file giving a Cell ID for each of the FASTQ files. Otherwise, the name of the FASTQ files will be used to name the cells. The parameters regarding the alignment itself can also be modified as shown in Figure 4.
STARsolo Results
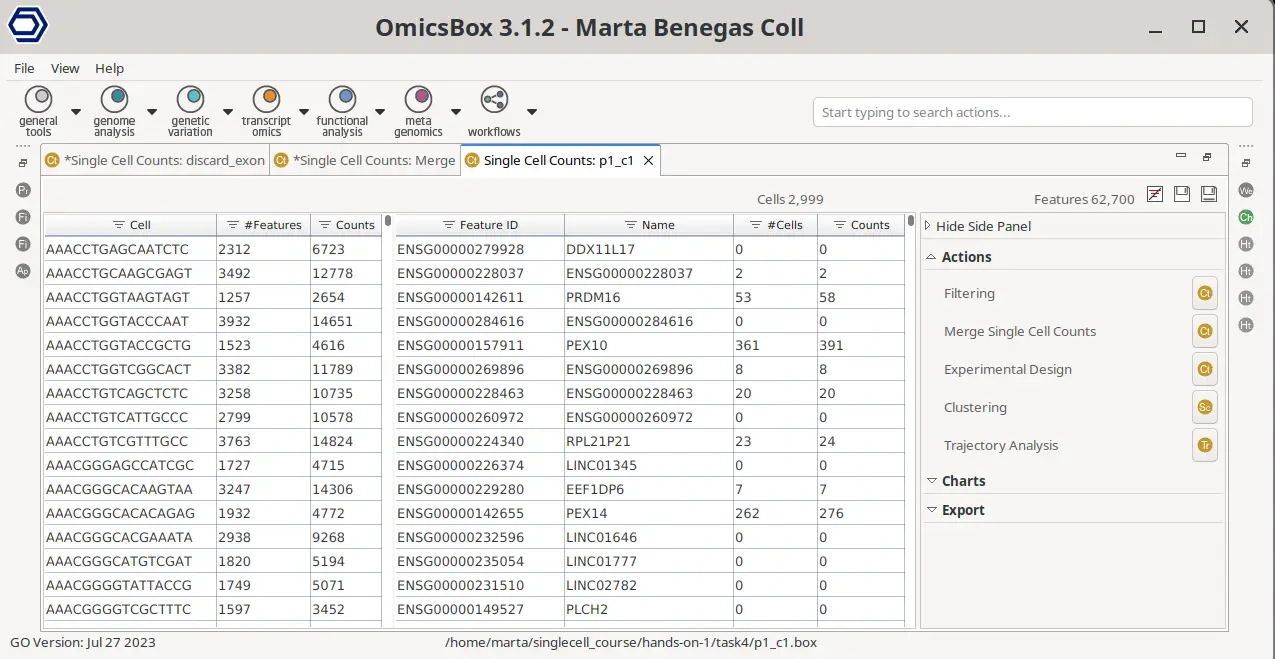
The main STARsolo result is a count matrix, which stores the UMI or read counts detected per gene in each cell. This count matrix is displayed in OmicsBox in a double viewer that summarizes the data for cells and genes (Figure 7). For each of the cells, it shows the total number of counts across all genes and the number of detected features, that is, the number of features with an expression value greater than 0. For the features or genes, it shows the total number of counts for that gene across all cells and the number of cells in which that gene is expressed. In addition, the table can be sorted and filtered by the different columns, allowing for an easy exploration of the count matrix.
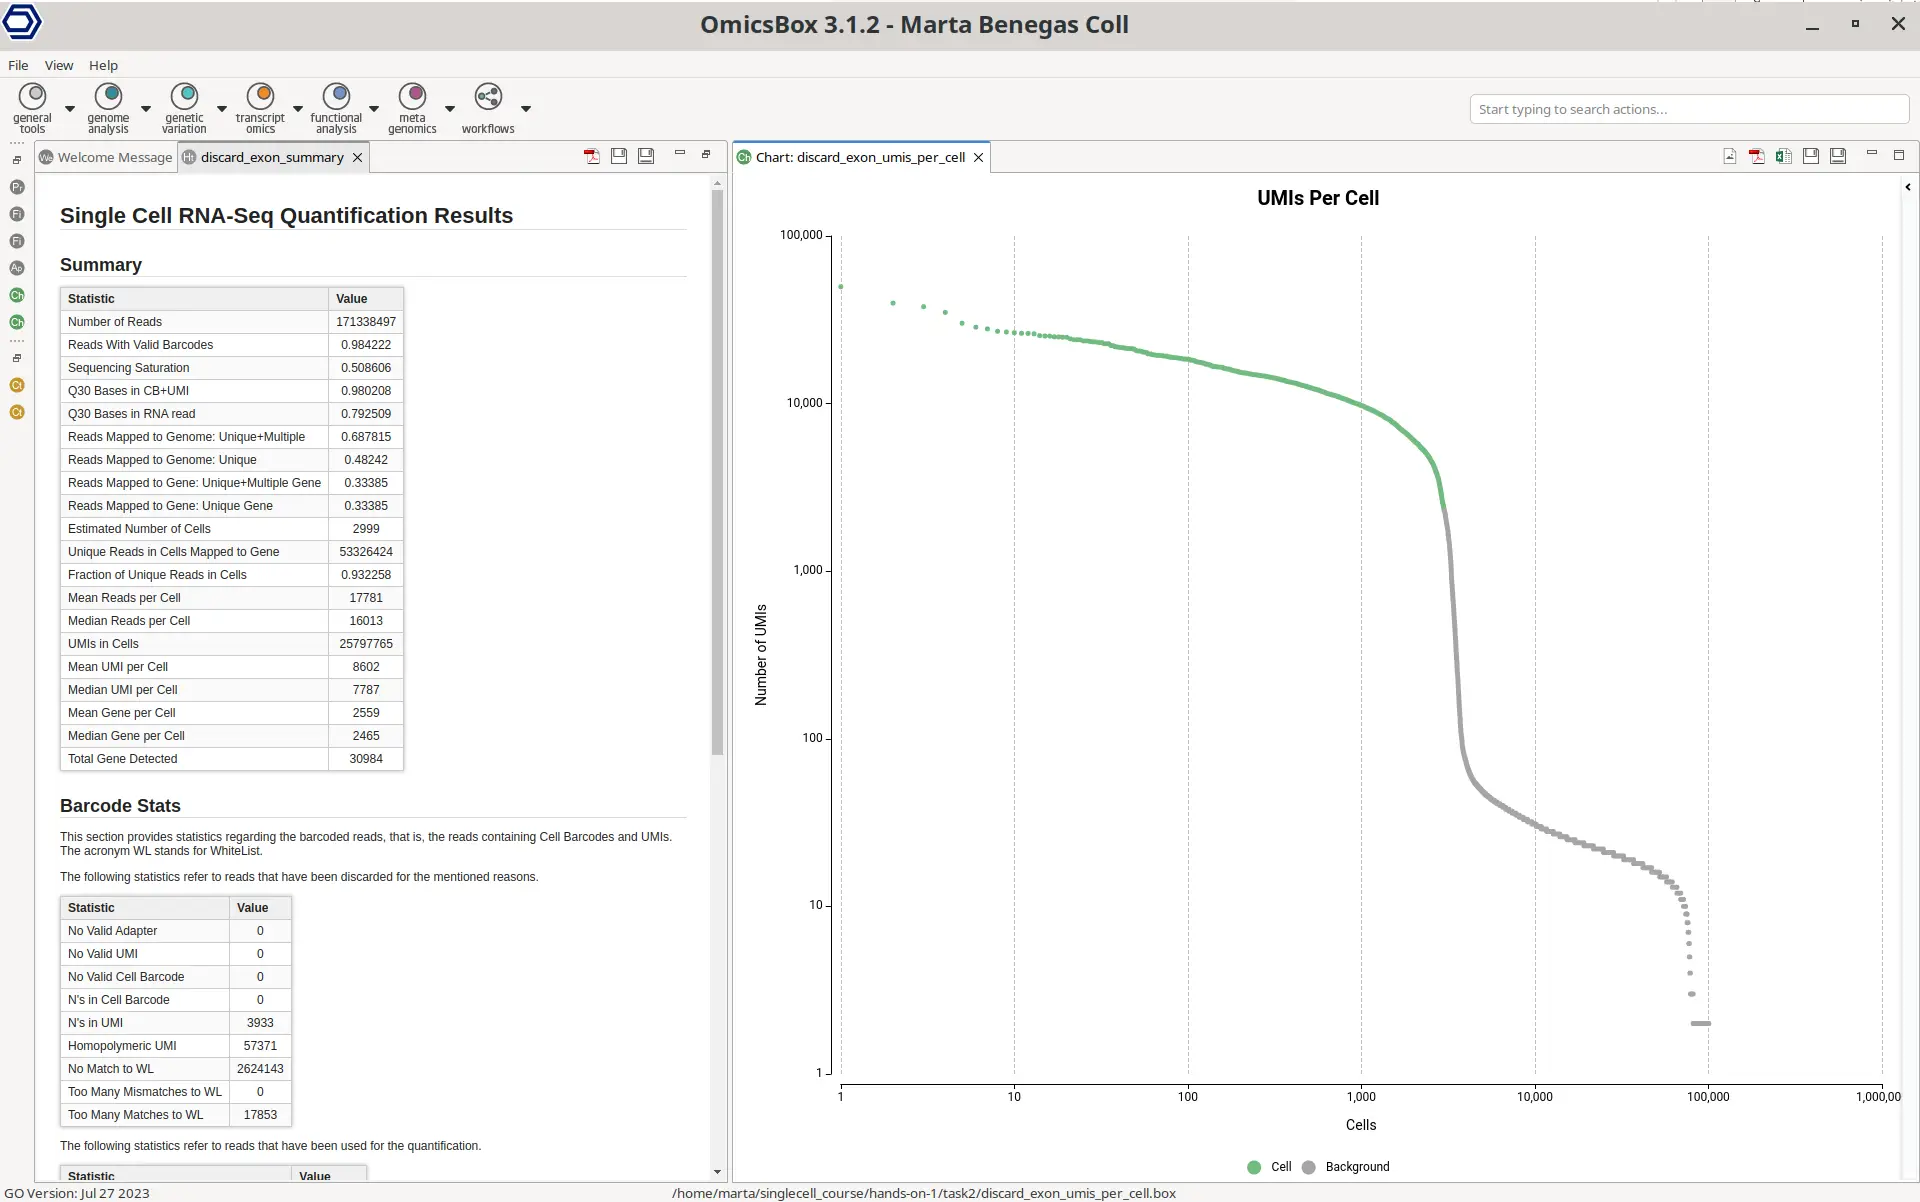
In addition, a summary report and a UMIs Per Cell plot are displayed (Figure 8). The summary report contains many different statistics that help in assessing the performance of the quantification. The Summary section contains metrics such as the mean reads per cell or the percentage of reads aligned to the genome. Ideally, those numbers should be as high as possible, since small values could indicate that the reads haven’t been correctly aligned to the genome and thus there may be a problem with the reference used or with the quality of the sequencing reads.
The UMIs Per Cell plot is particularly interesting in droplet-based technologies like 10x Chromium. The Y-axis has the total number of UMI counts and the X-axis contains all the Cell Barcodes detected, ordered by the total number of counts. The green dots are the cells kept in the final count matrix, whereas the green ones are discarded. Ideally, the number of kept cells should fall right before the sharp drop in the curve, since Cell Barcodes with a low number of counts assigned are very likely to contain ambient RNA or to be barcodes produced by sequencing errors (10x Genomics, 2023).
Exploration and Filtering of the Count Matrix
How do I interpret the distribution plots?
In order to better explore the count matrix, it is possible to generate plots with the distribution of counts and genes per cell (Figure 9). These plots are a combination of violin and box plots. Each of the dots is a cell and the value in the Y axis is the total number of counts or the total number of detected genes for that cell. The violin shows the density of cells in each of the areas of the plot, so it is easier to see the amount of cells having a certain amount of counts or genes. The boxplot shows the median, percentile 1, percentile 3, and the outlier threshold, so it provides more exact statistics about the distribution of the data.
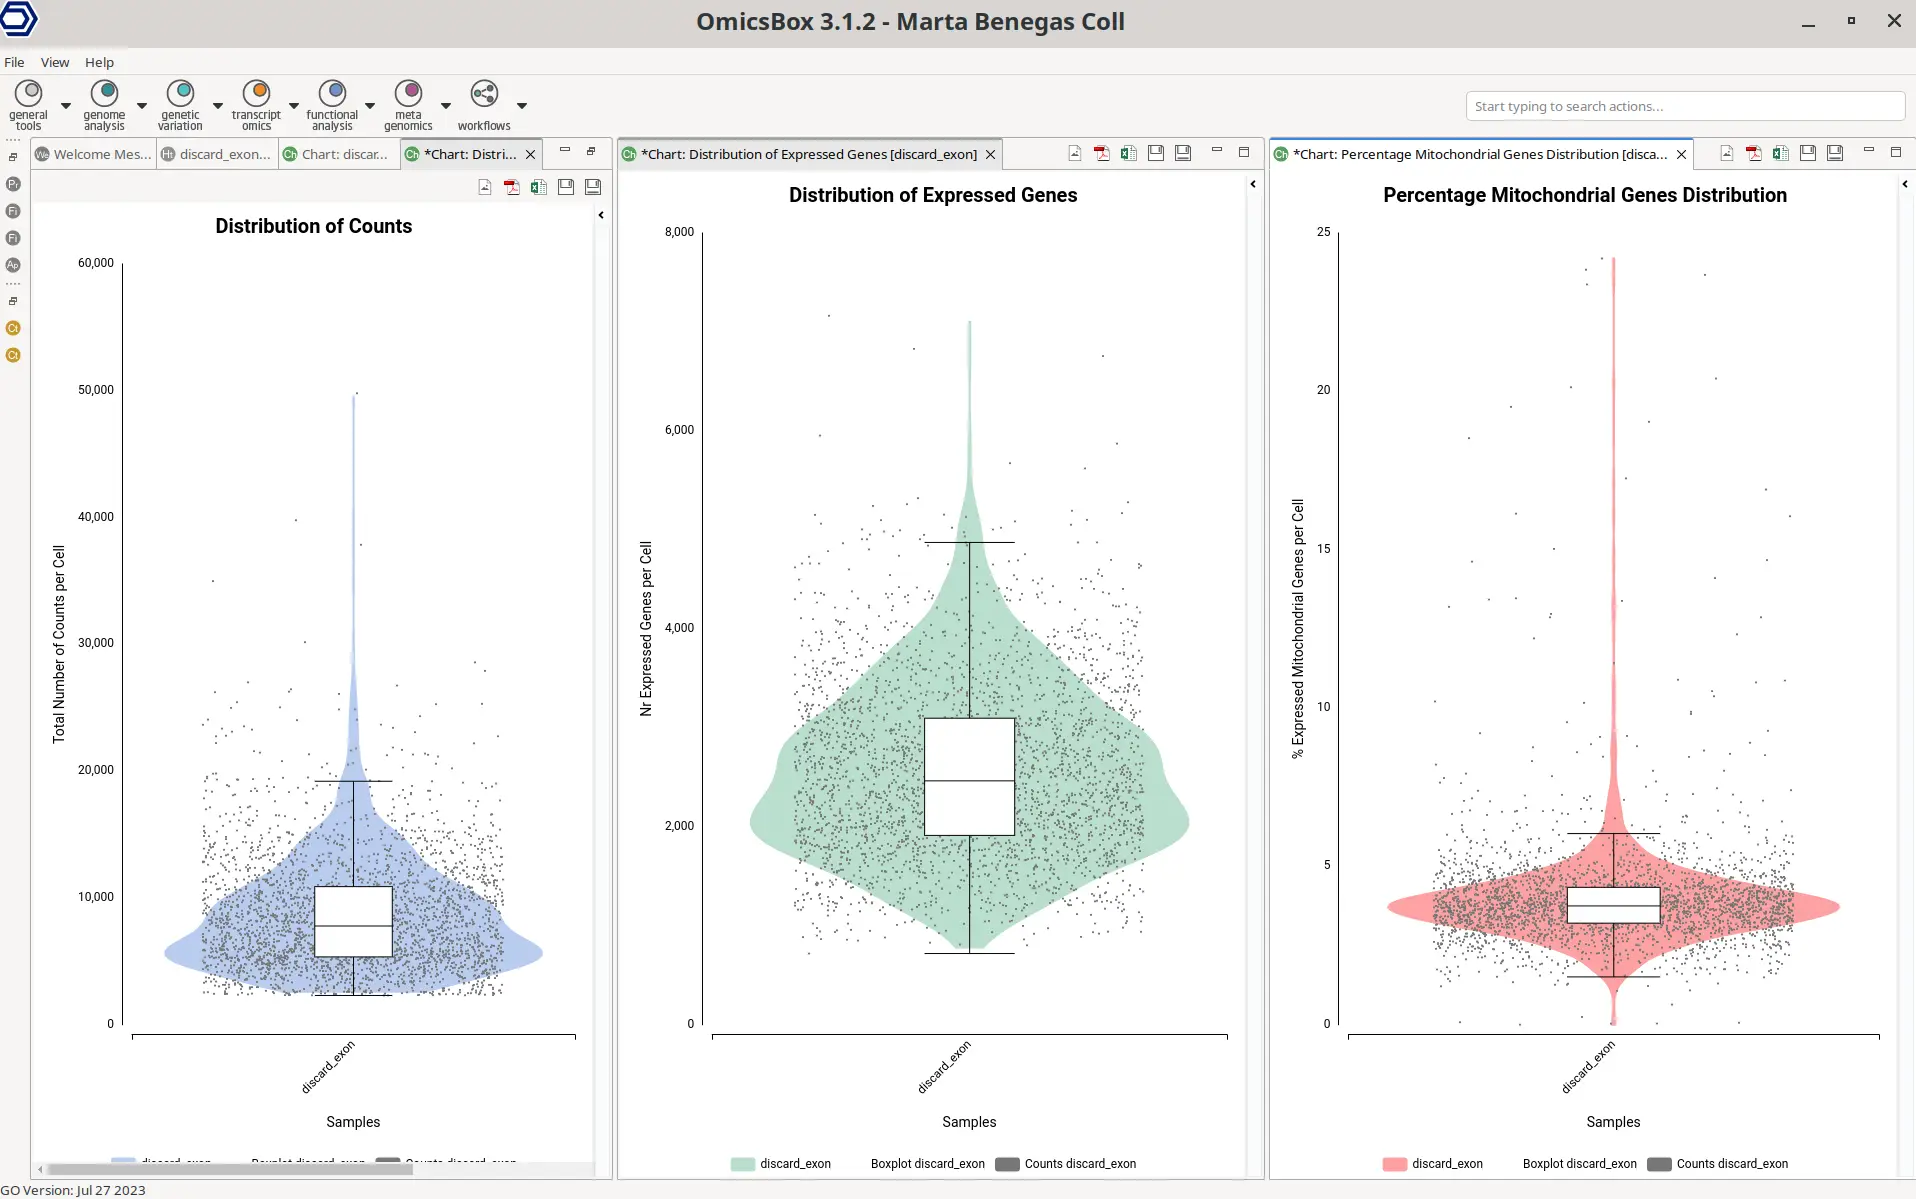
Why is it necessary to filter cells?
These plots help to decide filtering thresholds to the count matrix. It is recommended to filter cells with both a high and low total number of counts in comparison with the majority of the cells. The same applies to cells with a high or low number of detected genes. The lower threshold is applied to eliminate cells that may have been damaged during manipulation, resulting in lower counts. It may also filter cell barcodes generated from empty droplets with ambient RNA.
However, if a Cell Calling has been performed during STARsolo quantification, this lower threshold may not be needed. On the other hand, the upper threshold is applied in order to remove putative doublets or multiples. That is cell barcodes that have been tagged to two different cells. In this case, the reads coming from different cells are counted together since they have been assigned to the same cell barcode. This leads to cells with a higher amount of counts in comparison with the rest. It is important to filter them because in case two cells of very distinct cell types have been sequenced together, this could introduce bias to further downstream analysis.
In addition, it is recommended to filter cells with a high percentage of expressed mitochondrial genes. This could be indicative of dying or cells that have been broken during the manipulation. In the latter scenario, the mRNA content in the cytosol is lost.
However, mitochondrial RNA may still be present because it is protected inside the mitochondrial membrane. Filtering these cells is recommended. They may not accurately represent gene expression and could result in spurious findings.
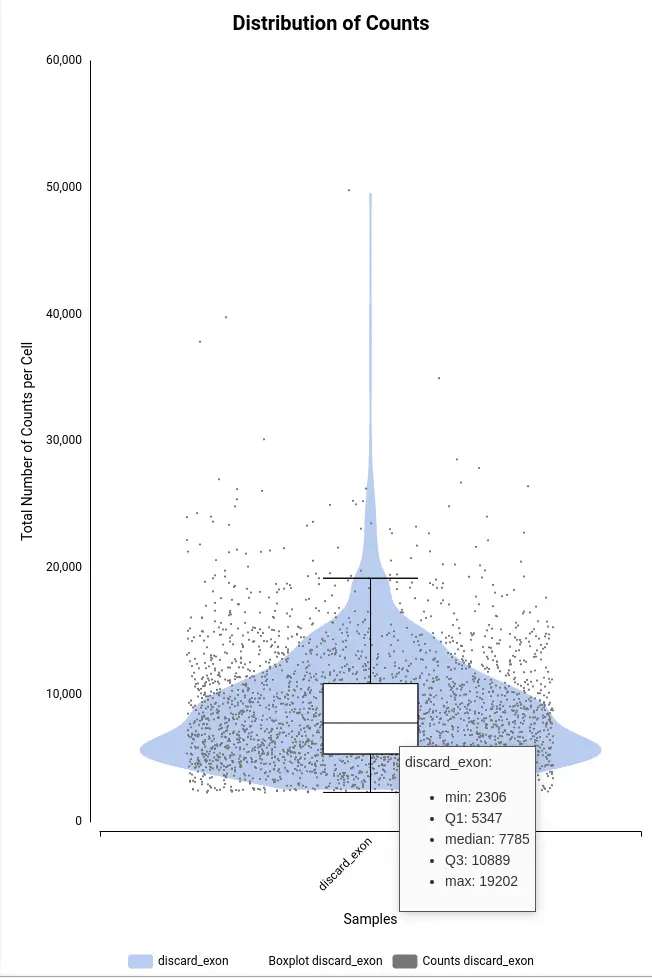
How do I decide the filtering thresholds?
In order to be more restrictive, a good option would be to filter all the cells detected as outliers. Those cells would be the ones above or under the whiskers in the boxplot. The threshold is determined by the minimum and maximum values of the boxplot.
These values are displayed in a tooltip that appears when the cursor is placed above the boxplot (Figure 10).
Another option would be to visually assess where the violin plot becomes narrow. The value in the Y-axis where this happens will be the threshold. This will filter a smaller amount of cells but still is a good approximation if we don’t want to filter too many cells.
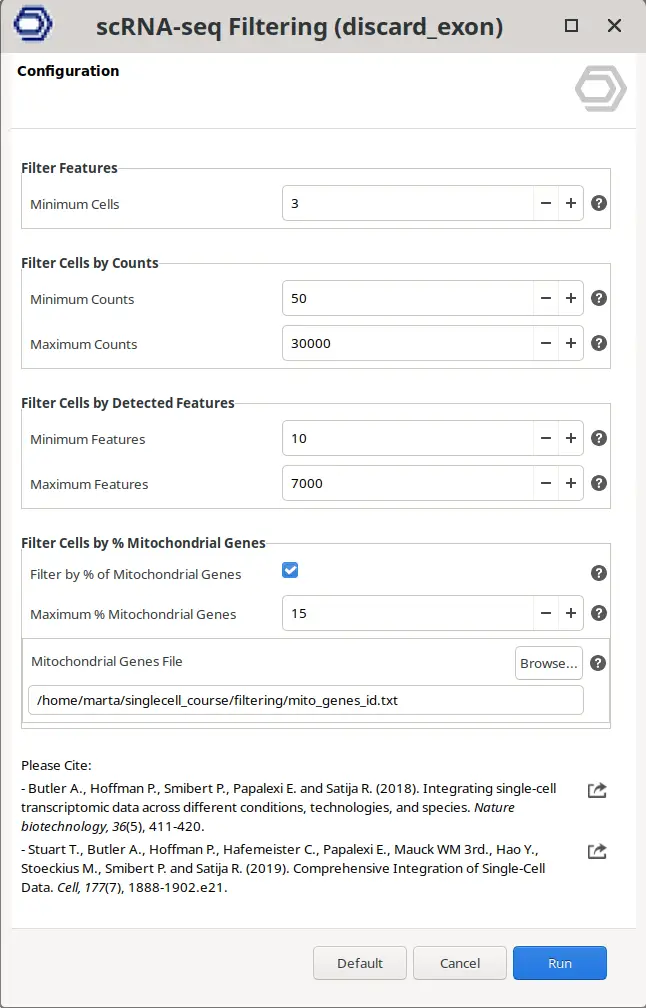
How do I filter the cells?
Within OmicsBox, it is really easy to filter the count matrix by going to the Side Panel > Actions > Filtering. This will open a new wizard in which it is possible to specify the chosen filters (Figure 11). The output will be another count table but with cells and genes filtered.
References
Picelli, Simone et al. “Full-length RNA-seq from single cells using Smart-seq2.” Nature protocols vol. 9,1 (2014): 171-81. doi:10.1038/nprot.2014.006
Verboom, Karen et al. “SMARTer single cell total RNA sequencing.” Nucleic acids research vol. 47,16 (2019): e93. doi:10.1093/nar/gkz535
Zheng, Grace X Y et al. “Massively parallel digital transcriptional profiling of single cells.” Nature communications vol. 8 14049. 16 Jan. 2017, doi:10.1038/ncomms14049
Macosko, Evan Z et al. “Highly Parallel Genome-wide Expression Profiling of Individual Cells Using Nanoliter Droplets.” Cell vol. 161,5 (2015): 1202-1214. doi:10.1016/j.cell.2015.05.002
Keren-Shaul, Hadas et al. “MARS-seq2.0: an experimental and analytical pipeline for indexed sorting combined with single-cell RNA sequencing.” Nature protocols vol. 14,6 (2019): 1841-1862. doi:10.1038/s41596-019-0164-4
Yanai, Itai, and Tamar Hashimshony. “CEL-Seq2-Single-Cell RNA Sequencing by Multiplexed Linear Amplification.” Methods in molecular biology (Clifton, N.J.) vol. 1979 (2019): 45-56. doi:10.1007/978-1-4939-9240-9_4
Probst, Victoria et al. “Benchmarking full-length transcript single cell mRNA sequencing protocols.” BMC genomics vol. 23,1 860. 29 Dec. 2022, doi:10.1186/s12864-022-09014-5
B. Kaminow, D. Yunusov, A. Dobin. STARsolo: accurate, fast and versatile mapping/quantification of single-cell and single-nucleus RNA-seq data. bioRxiv 2021.05.05.442755; doi: https://doi.org/10.1101/2021.05.05.442755
Brüning RS, et. al. Comparative analysis of common alignment tools for single-cell RNA sequencing. Gigascience. 2022 Jan 27;11:giac001. doi: 10.1093/gigascience/giac001. PMID: 35084033; PMCID: PMC8848315.
Teichmann Group. Single Cell Genomics Library Structure. Retrieved September 21, 2023, from https://teichlab.github.io/scg_lib_structs/ .
10x Genomics. A Guided Tour of the Barcode Rank Plot. Retrieved October 05, 2023, from https://support.10xgenomics.com/single-cell-gene-expression/software/pipelines/latest/advanced/barcode-rank-plot .

About the Author
 Marta Benegas
Marta studied biotechnology at the Valencia Polytechnic University (UPV) and continued her studies with a Master's in Bioinformatics at the Autonomous University of Barcelona (UAB), Spain. After her master's degree, she started her professional career at Biobam where she is now working as a bioinformatics specialist and support manager. At the moment she is mainly focused on Single-Cell technologies developing various pipelines which allow getting from reads to functional insights at a single-cell resolution. These developments are available in OmicsBox, BioBam’s software solution.

