OmicsBox’s Single Cell Data Analysis encompasses a comprehensive range of steps, spanning read quantification, pre-processing, clustering, differential expression analysis, and even advanced analyses like trajectory analysis and functional enrichment. This blog post will focus on general trajectory inference using Monocle3 within OmicsBox.
Pseudotime Analysis with Monocle3
Monocle3, developed by the Trapnell lab, is a scRNA-Seq data analysis toolkit written in R that pioneered the concept of pseudotime. Monocle 3 serves three primary functions in scRNA-data analysis:
Clustering and classifying cells into putative cell types.
Assigning pseudotime to cells and constructing single-cell trajectories to examine developmental processes.
Conducting differential expression analysis to reveal differential genes between pseudotime ranges or clusters.
Cell Lineages
Each cell arises from pre-existing cells through predetermined transcriptional events. The developmental history of a differentiated cell from a progenitor cell creates cell lineage(s). Single-cell clusters limit cells to defined, isolated cluster states that differ from native cells. A cell may exist anywhere within the cell lineage(s) or at decision points within them. ScRNA-Seq experiments capture millions of cells undergoing transcriptional changes. Assuming they belong to only isolated clusters provides a limited view. Identifying dynamic cell states is crucial for understanding cell fate decisions.
Trajectory Inference Tools
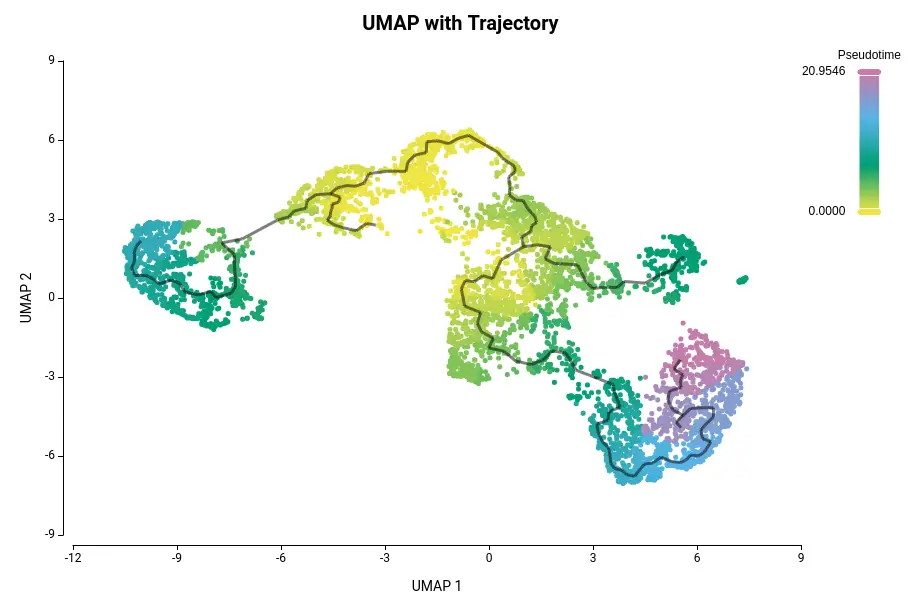
Trajectory inference methods are computational tools developed for this analysis. They aid in determining cell fate decisions in dynamic transcriptional units known as pseudotime. Pseudotime represents a cell’s distance from its progenitors/precursors in transcriptional space. Cells aligned along pseudotime create a cell trajectory akin to cell lineages (see Figure 1).
Unraveling Pseudotime
Pseudotime is an unobserved dimension that measures a cell’s progression through transitions. It may differ from the experimental capture time but serves as a proxy for actual time. To perform a pseudotime analysis, a root node or starting point is required as a reference for trajectory construction. Typically, this reference can be provided in two ways:
- Progenitor Cells: If users have information about cell types in the dataset, the algorithm uses that information to find the nearest principal point (cell) in the trajectory graph with the highest number of progenitor cells as neighbors. This cell is assigned pseudotime 0, and geodesic distances among other cells are calculated from there.
- Using Experimental Time: Datasets with laboratory capture time are ideal for trajectory analysis. Information about experimental real-time guides the algorithm in searching for starting points. This information is included in the experimental design file.
The Art of Trajectory Inference
A trajectory is a graph overlaid on a traditional UMAP. Each UMAP point corresponds to a cell in the experiment. Cells belong to clusters or partitions (superclusters). Monocle3 algorithms can draw trajectories within a partition or between clusters of different partitions, influencing inference results. Trajectories can be branched, bifurcated, cyclic, or linear, depending on the biological system. Trajectory inference aims to determine dynamic process patterns and arrange cells based on progression. Pseudotime assignment enables differential expression analysis to identify genes expressed at branching points.
Additional insights with OmicxBox
- Comprehensive and streamlined workflow
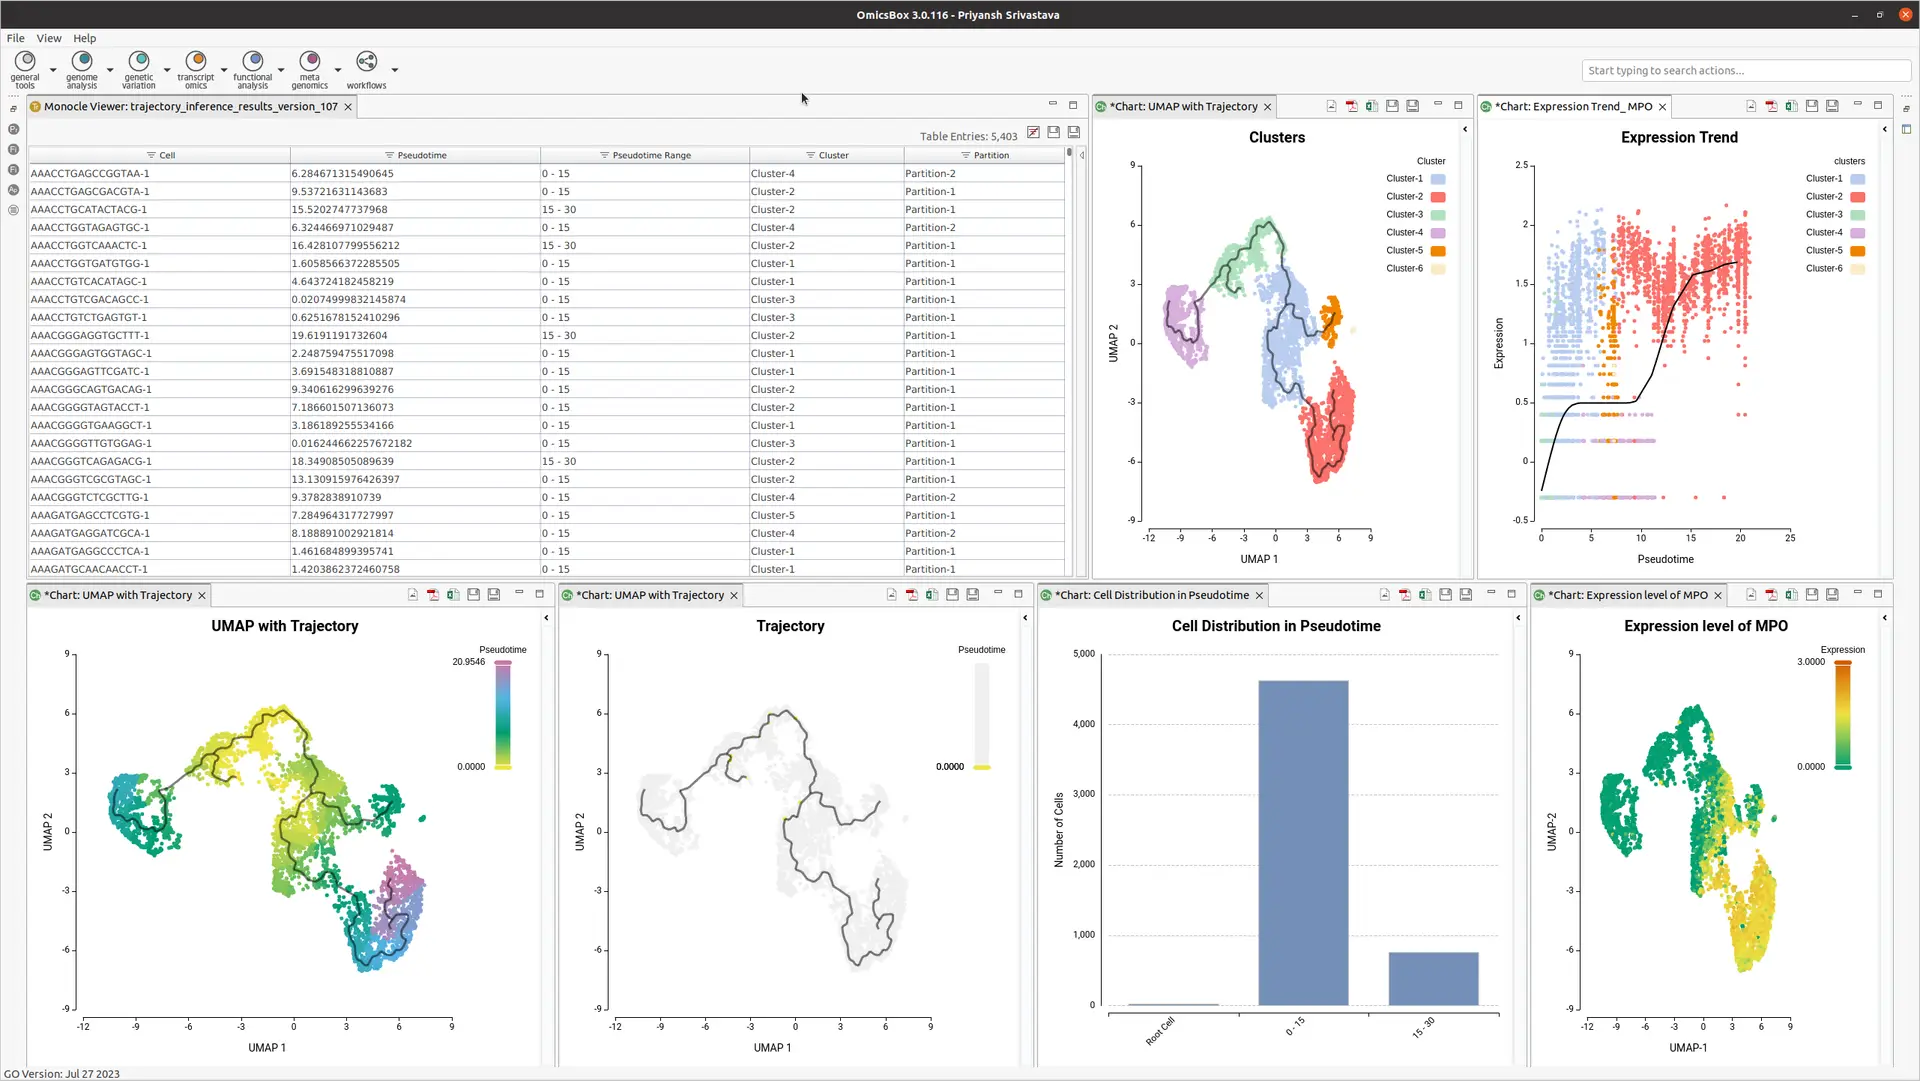
OmicsBox offers an end-to-end workflow, taking raw count tables and experimental design files as inputs (see Figure 2). It generates well-formatted output, suitable for further analysis. Results include tables and interactive visualizations, simplifying curation and evaluation. Side action panel options allow the creation of statistical plots, such as distribution plots, gene expression UMAPs, and trend plots, with a few clicks.
- Interactive data visualization
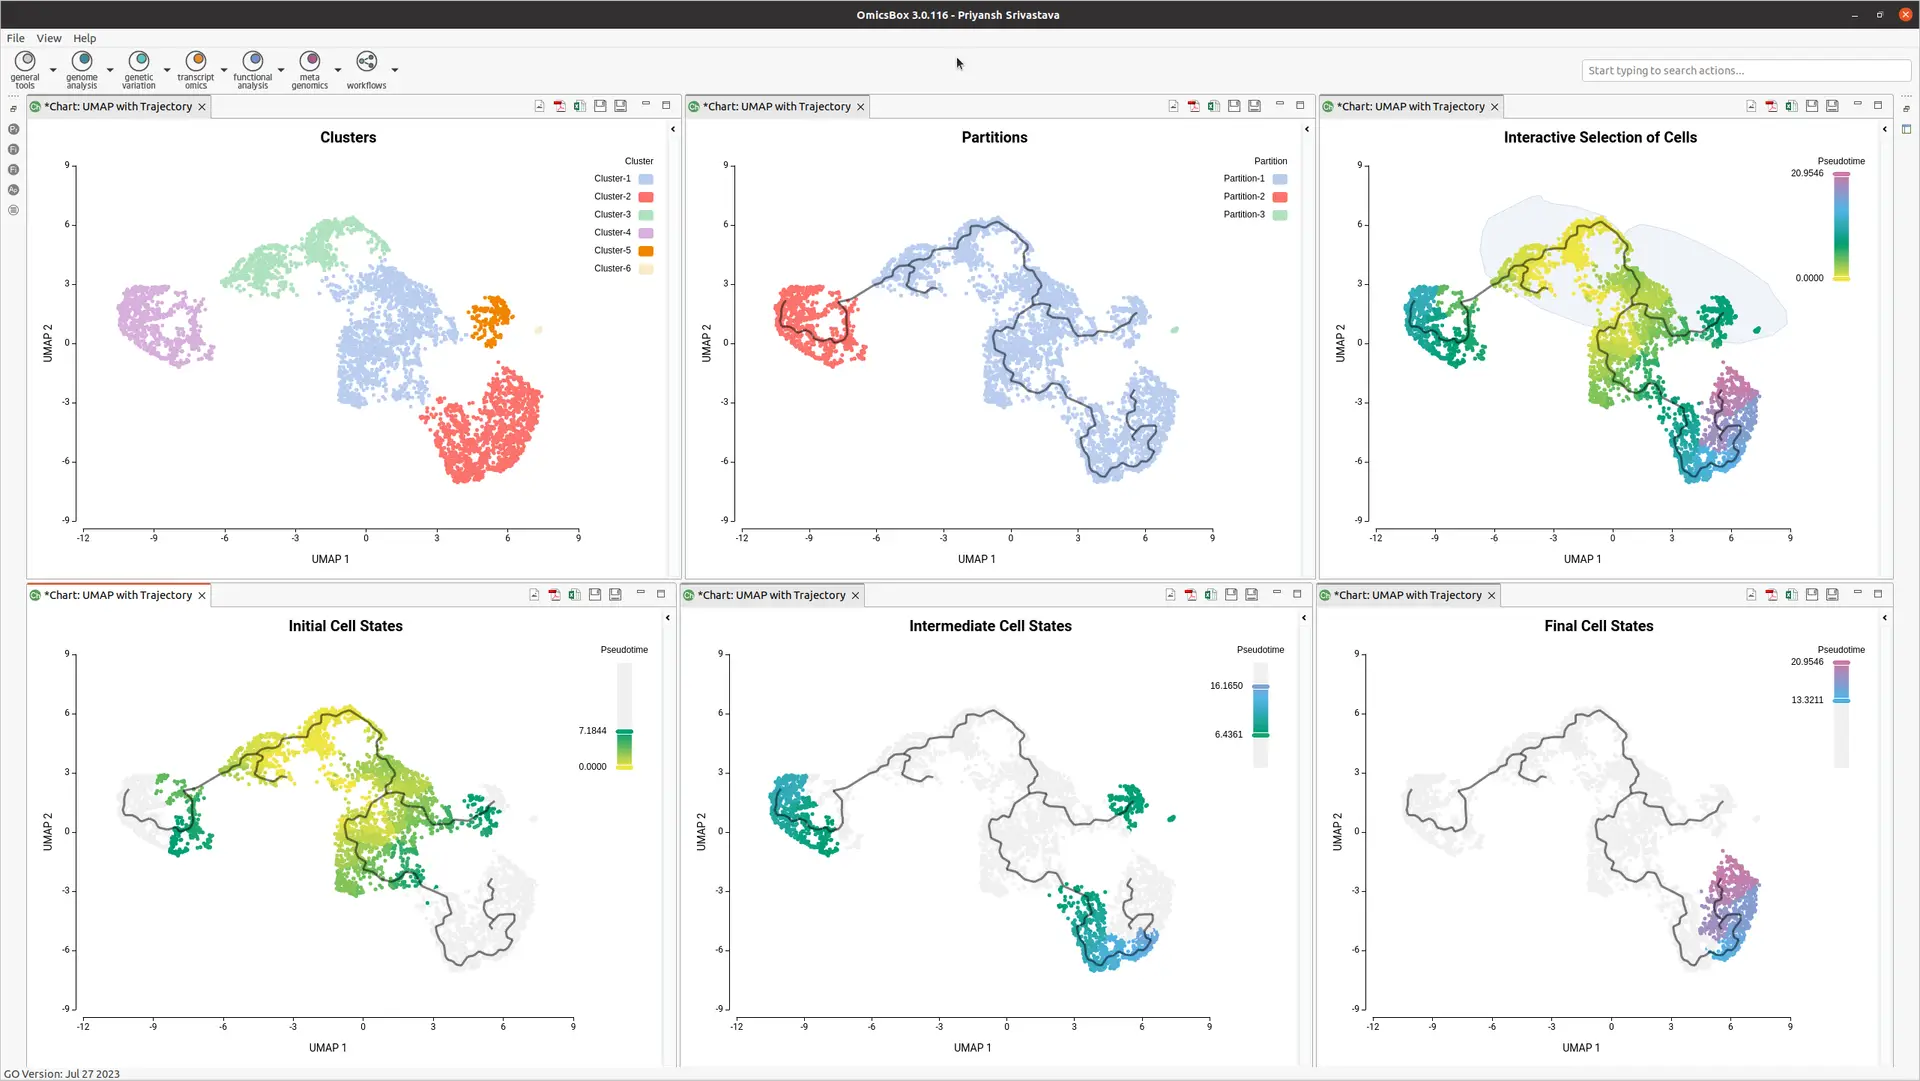
OmicsBox enhances analysis with interactive visualization of assigned pseudotime (see Figure 3). Interactive image editor tools provide insights into progression patterns and offer better control over the trajectory plot.
- Interactive data Selection
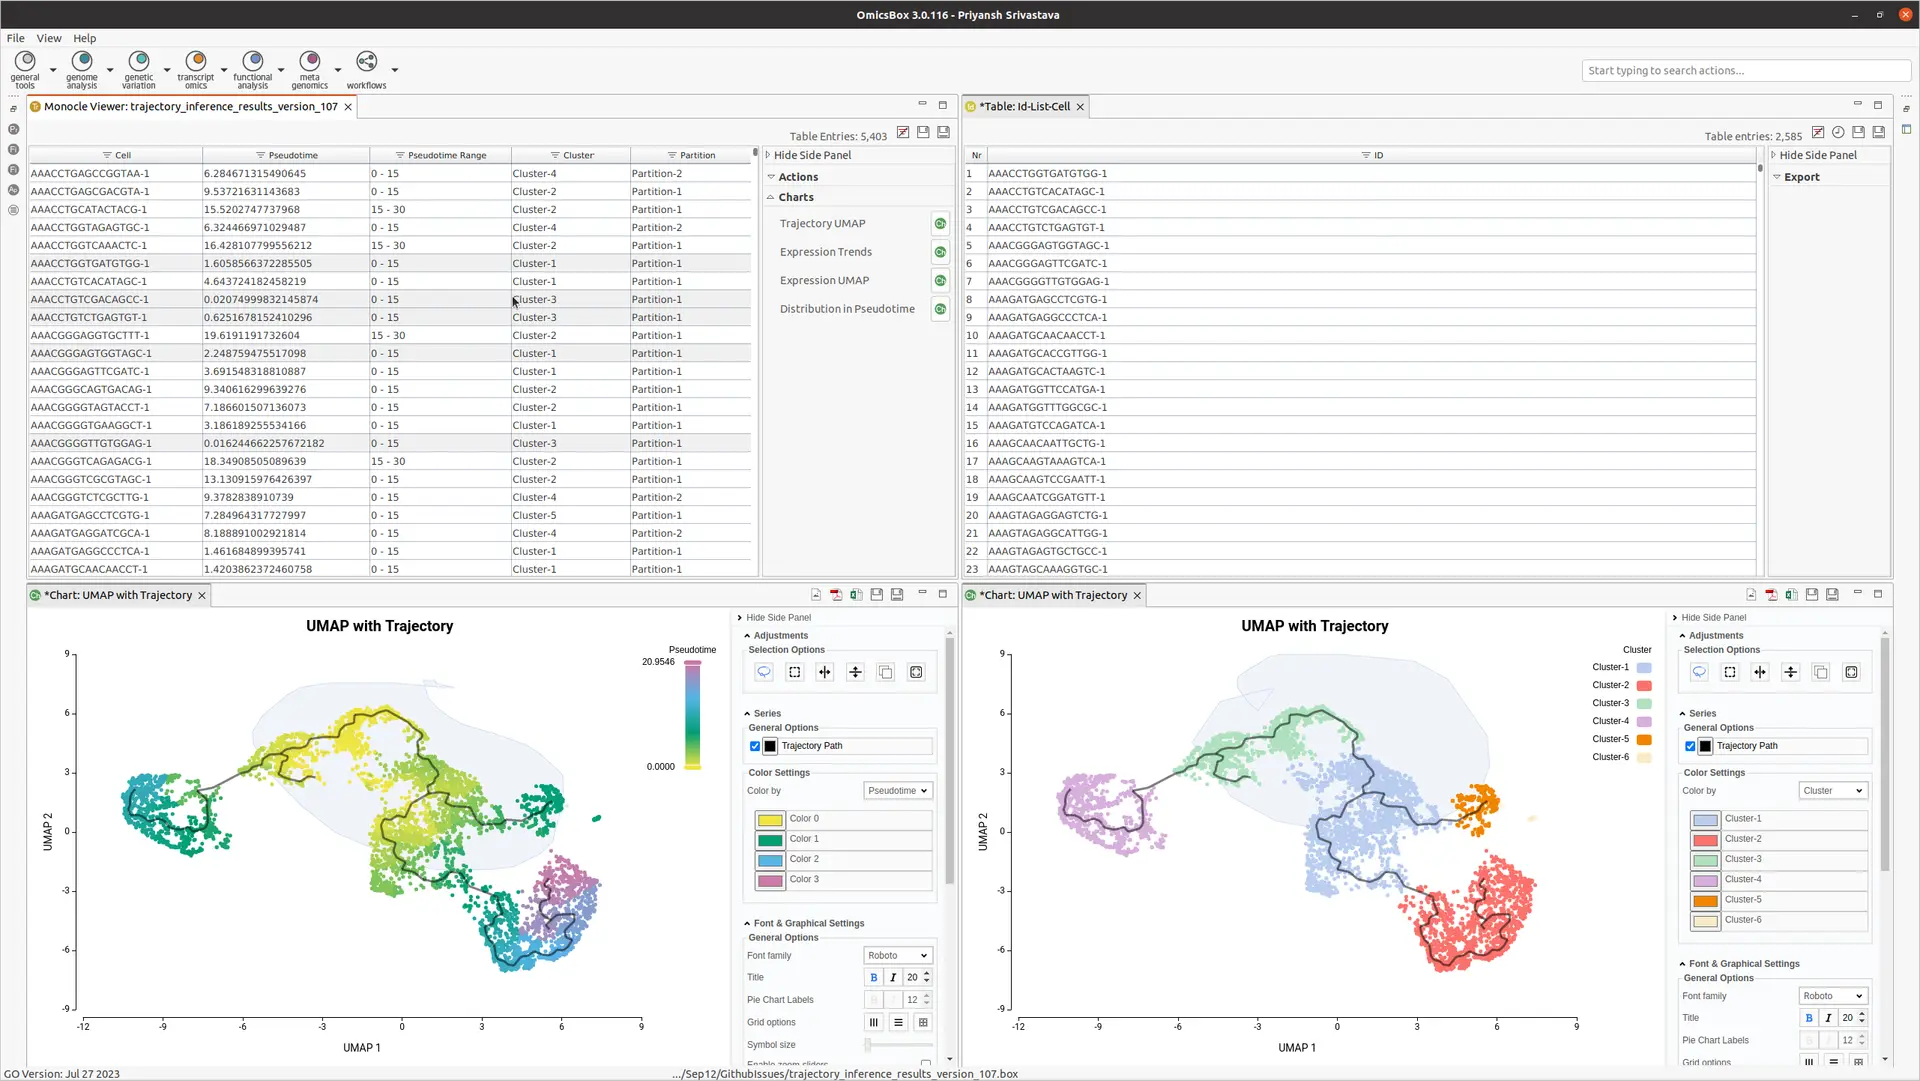
OmicsBox enables the interactive selection of cells from the UMAP embedding (see Figure 4). This user-friendly feature allows dataset subsetting and selecting cells as root cells, streamlining the data analysis.
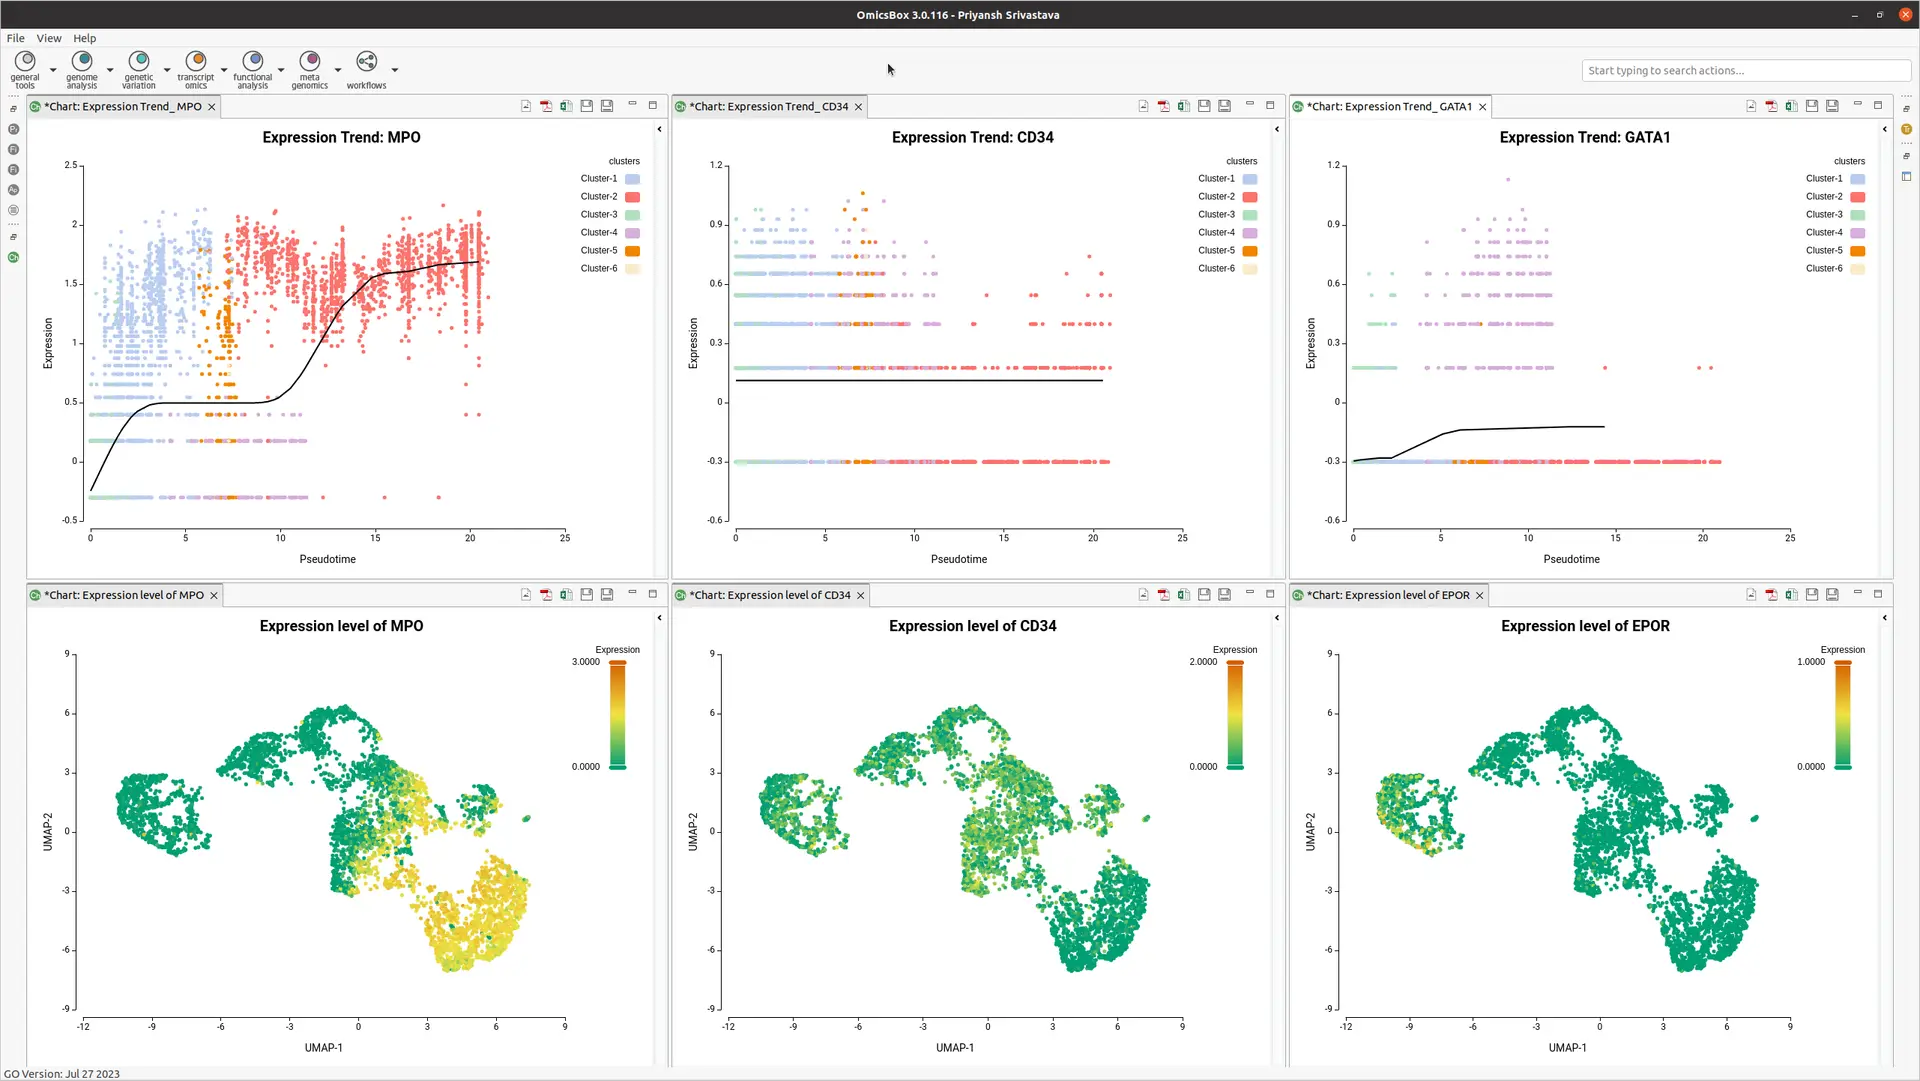
- Feature Expression Trends and UMAP
OmicsBox offers trend plots using powerful spline interpolations to visualize gene expression along pseudotime. Expression can also be plotted on a UMAP, allowing visualization of marker gene expression (see Figure 5).
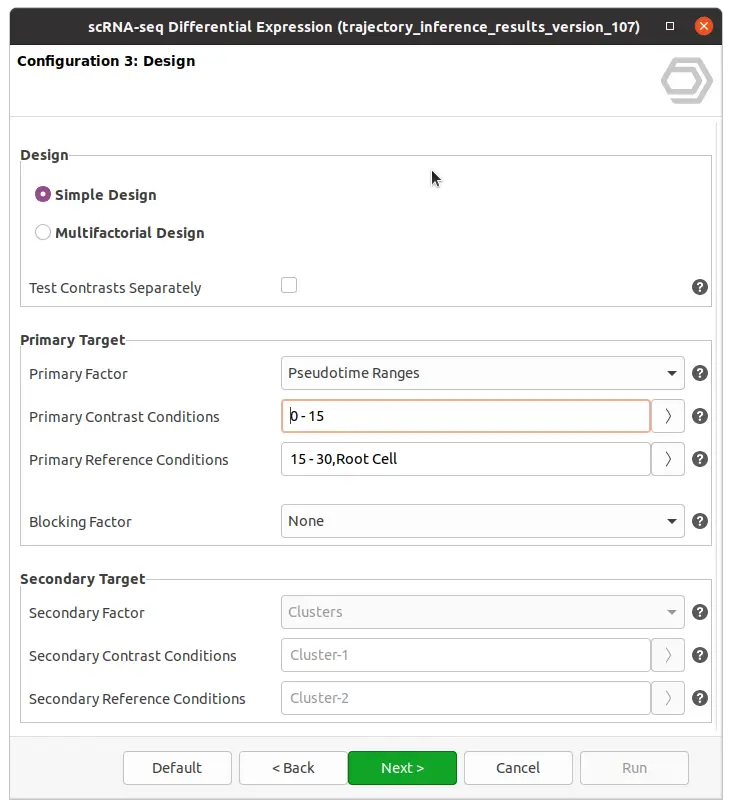
- Integration with Differential Expression Wizard
After successful trajectory inference, OmicsBox integrates with the “Differential Expression” analysis from the side panel. Raw counts can be used to perform differential expressions among pseudotime ranges of cluster labels (see Figure 6).
Caution
Trajectory inference can be applied to any dataset, but it’s essential to assess if it contains cells undergoing a developmental process intuitively. Drawing a trajectory for cells involved in a developmental process yields more meaningful results than using cells from different tissues.
Infinite Pseudotime
“Infinite pseudotime” in trajectory analysis refers to cells that couldn’t be accurately placed on the developmental trajectory due to algorithm limitations. Cells at the beginning of a trajectory have lower pseudotime values, while those at the end have higher values. “Infinite pseudotime” may indicate issues like data noise, rare cell states, or technical problems. Revisiting the analysis and examining data preprocessing may be necessary.
References
- Qiu, Xiaojie, et al. “Reversed Graph Embedding Resolves Complex Single-Cell Trajectories.” Nature Methods, vol. 14, no. 10, 21 Aug. 2017, pp. 979–982, 10.1038/nmeth.4402.
- Qiu et al.“Single-Cell mRNA Quantification and Differential Analysis with Census.” Nature Methods, vol. 14, no. 3, 23 Jan. 2017, pp. 309–315, 10.1038/nmeth.4150.
- Trapnell, Cole, et al. “Pseudo-Temporal Ordering of Individual Cells Reveals Dynamics and Regulators of Cell Fate Decisions.” Nature Biotechnology, vol. 32, no. 4, 1 Apr. 2014, pp. 381–386, 0.1038/nbt.2859.
- Reid, John E., and Lorenz Wernisch. “Pseudotime Estimation: Deconfounding Single Cell Time Series.” Bioinformatics, vol. 32, no. 19, 17 June 2016, pp. 2973–2980, 10.1093/bioinformatics/btw372.
Useful Links
- User Manual
- Example Dataset
- Tutorial
- Monocle3 Home