Why Differential Expression Analysis with Single-cell RNA-seq data?
The differential expression (DE) analysis has been used in bulk RNA-seq analysis for many years. It statistically measures changes in gene expression levels between different groups. With bulk RNA-seq analysis many cells are sequenced at the same time, so gene expression levels are commonly measured at the tissue level. Thus, the differences between samples and conditions are tested at the tissue level as well.
In contrast, Single-cell RNA-seq measures the expression cell by cell which adds more detail to the analysis. As a result of this characteristic, it is possible to identify groups of cells with different expression patterns inside the tissues, which putatively correspond to different cell types. Applied to differential expression analysis, Single-cell RNA-seq not only allows to test between samples and conditions but also between cell types, thus adding more complexity to the analysis. Thanks to applying DE to Single-cell data, it is possible to look for differences in gene expression between, for example, healthy and ill donors at the cell type level.
scRNA-seq Differential Expression with OmicsBox
These recent years, tools specifically designed to perform Differential Expression analysis on Single-cell data have been developed. However, benchmarking analyses have proven that tools originally designed for bulk RNA-Seq work even better than specialized tools. That’s why OmicsBox uses the R package EdgeR (Robinson et. al., 2009) to perform the DE analysis on single-cell data.
The OmicsBox tool offers different steps to fine-tune the analysis. Firstly, it has multiple options to filter genes or features with low counts. This step is highly recommendable since it reduces biological noise. Moreover, in the case of having cells coming from multiple biological replicates, a pseudobulk analysis is performed. This methodology has proven to give better results than considering each cell as a replicate. In addition, it is possible to specify a blocking factor to adjust for differences produced by a factor that is not of interest. Finally, both simple and multifactorial designs can be performed. Please visit the OmicsBox User’s Manual for more details about the implementation.
The Differential Expression analysis can be performed directly after the scRNA-Seq Clustering or the Trajectory Analysis. These tools assign each cell to a group (a cluster in the former and a pseudotime range in the latter). It is a very common and recommendable step to perform a DE analysis between these groups to uncover the differences in gene expression that have driven the grouping.
Highlights
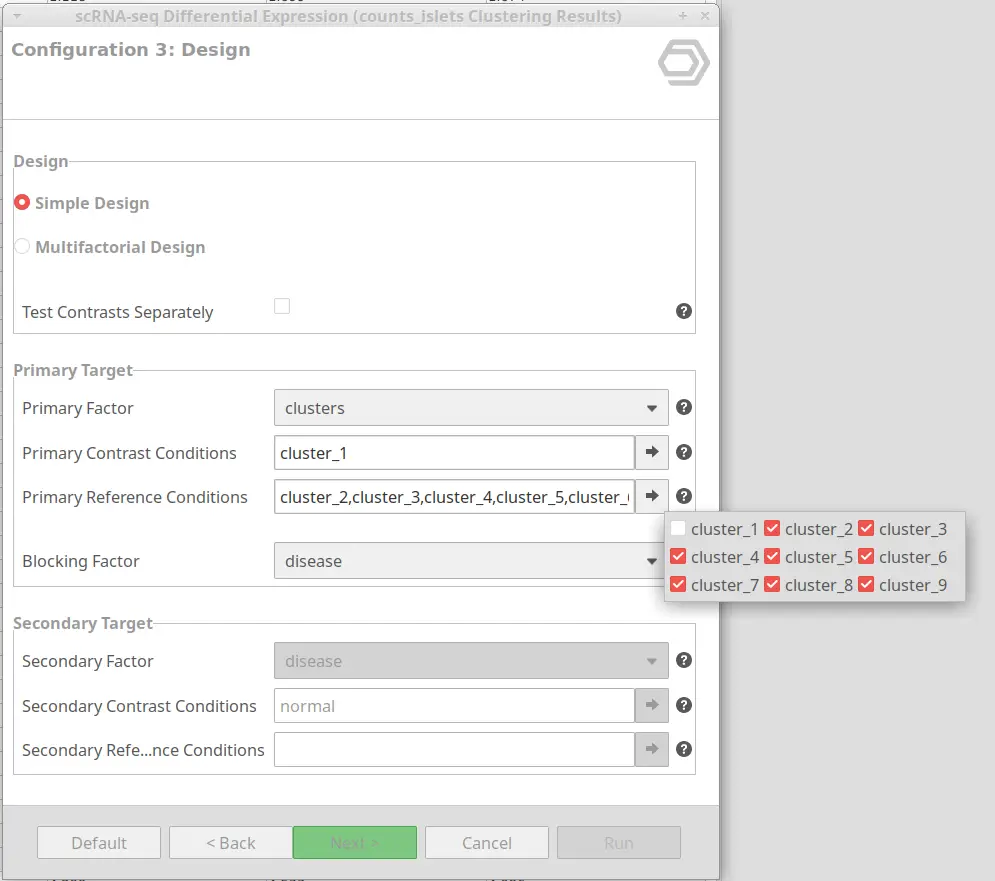
- OmicsBox implementation for Single-cell Differential Expression Analysis is highly customizable and it allows many different configurations. It can be easily configured by selecting which conditions to use as contrast and reference in the wizard, with no need for complex model designing. Please visit this blog post for more details and examples.
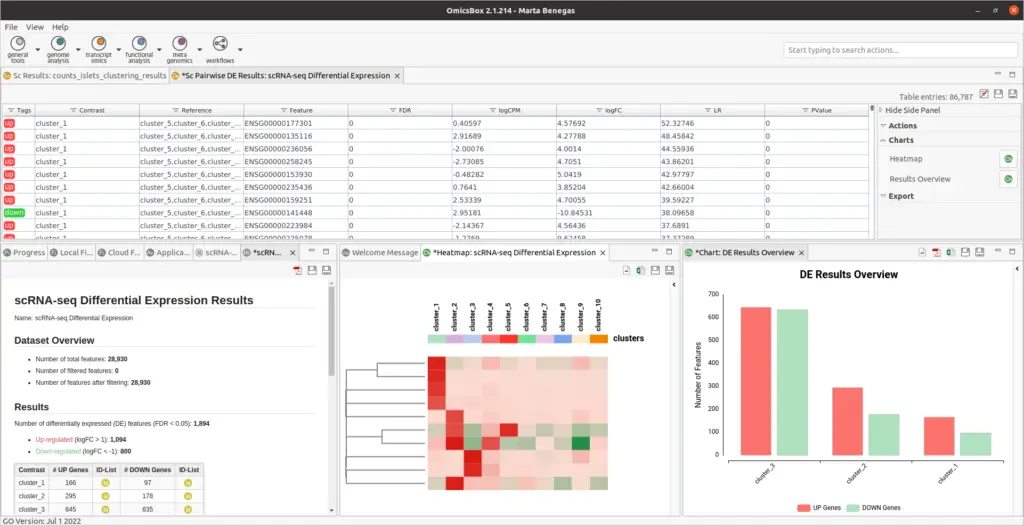
- Results are summarized in a table with statistics obtained for each feature (p-value, FDR, logFC, etc.). In addition, the criteria used for labeling a feature ad up- or down-regulated can be comfortably updated from the Side Panel.
- It is possible to visualize the top differentially expressed genes with a Heatmap plot. The expression values of many genes across the different conditions can be displayed at the same time.
- The Summary Report and the Results Overview plot provide a good summary of the results.
- Functional Enrichment Analysis can be directly performed from Differential Expression results. Adding a functional annotation, it is possible to perform a Fisher’s Exact Test to find GOs (or functions) more enriched in a particular condition.
Useful Links

About the Author
 Marta Benegas
Marta studied biotechnology at the Valencia Polytechnic University (UPV) and continued her studies with a Master's in Bioinformatics at the Autonomous University of Barcelona (UAB), Spain. After her master's degree, she started her professional career at Biobam where she is now working as a bioinformatics specialist and support manager. At the moment she is mainly focused on Single-Cell technologies developing various pipelines which allow getting from reads to functional insights at a single-cell resolution. These developments are available in OmicsBox, BioBam’s software solution.
")
