A functional enrichment analysis is the procedure of identifying functions that are over- or under-represented among a set of genes and may have an association with an experimental condition (e.g., phenotype or drug treatment). Obtaining functional profiles for sets of genes helps to gain a better understanding of the underlying biological processes. Two common analyses to test for enrichment are Fisher’s Exact Test (FET) and the Gene Set Enrichment Analysis (GSEA).
Fisher’s Exact Test
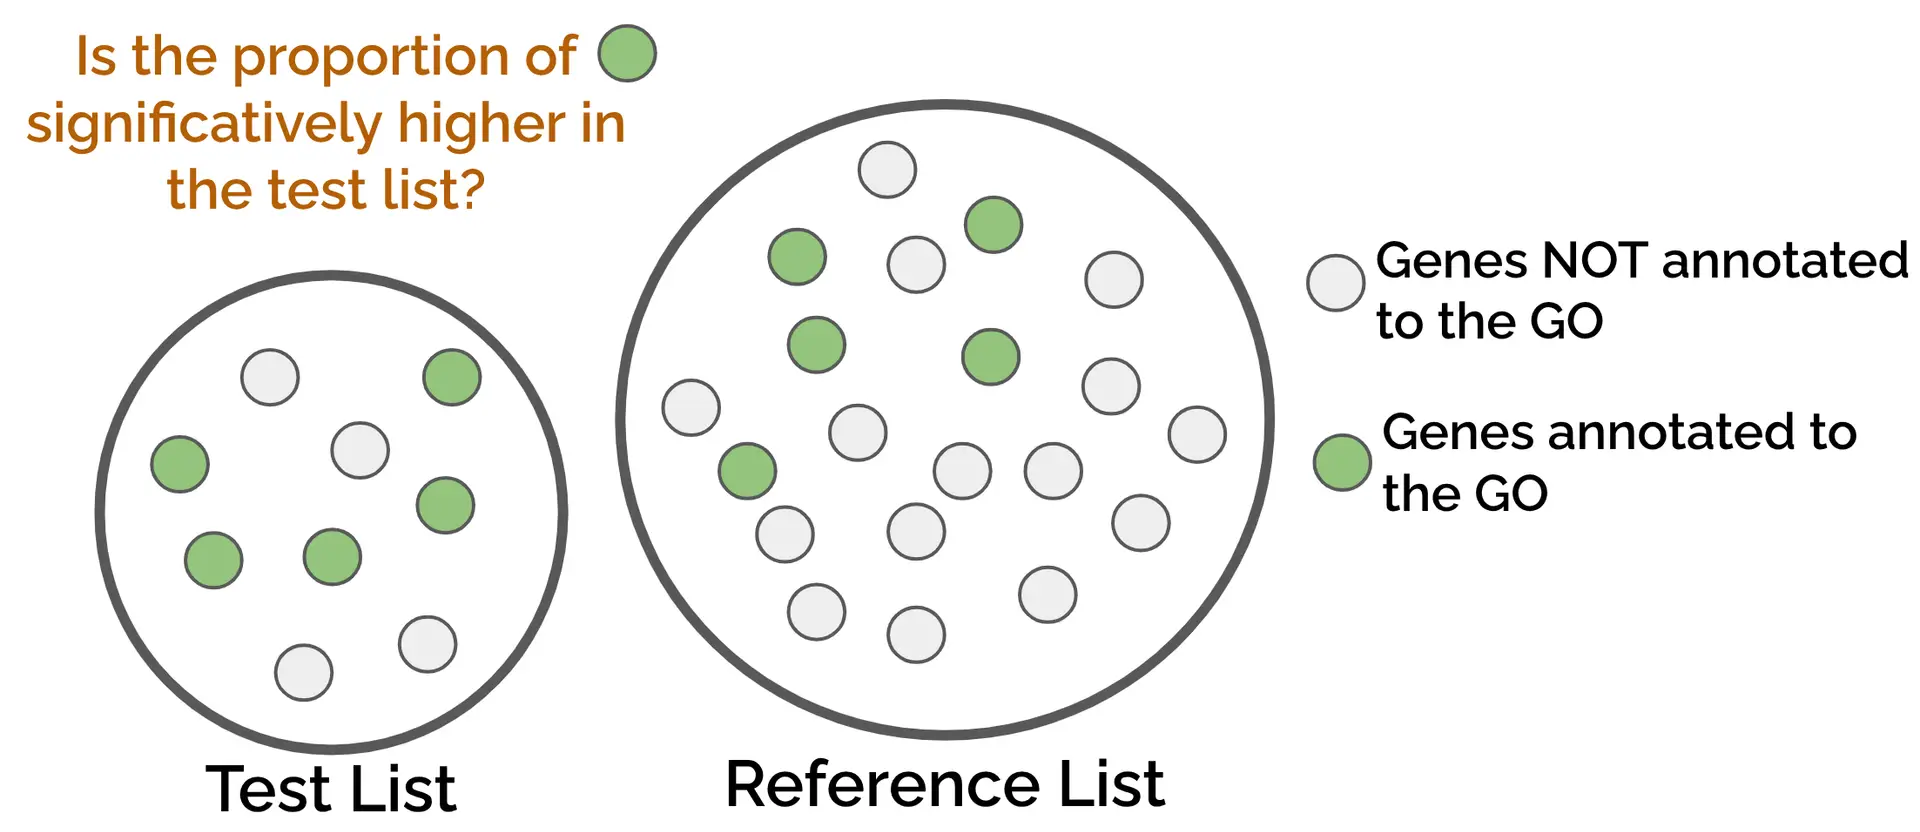
This method compares the functional annotations of two lists of genes, the test and the reference, against each other. To see if a specific GO term is enriched on a given list of genes, it assesses if the genes annotated to the GO term are more frequent in the test list compared to the reference list or background (Figure 1). This type of enrichment is calculated via a contingency table.
The test gene list can be composed of up-regulated genes, candidate genes from the literature, or any list of genes we are interested in. The reference list usually contains all the genes present in our dataset, but it can also be any list of genes we want to specifically test against the test list (e.g., down-regulated genes).
Gene Set Enrichment Analysis (GSEA)
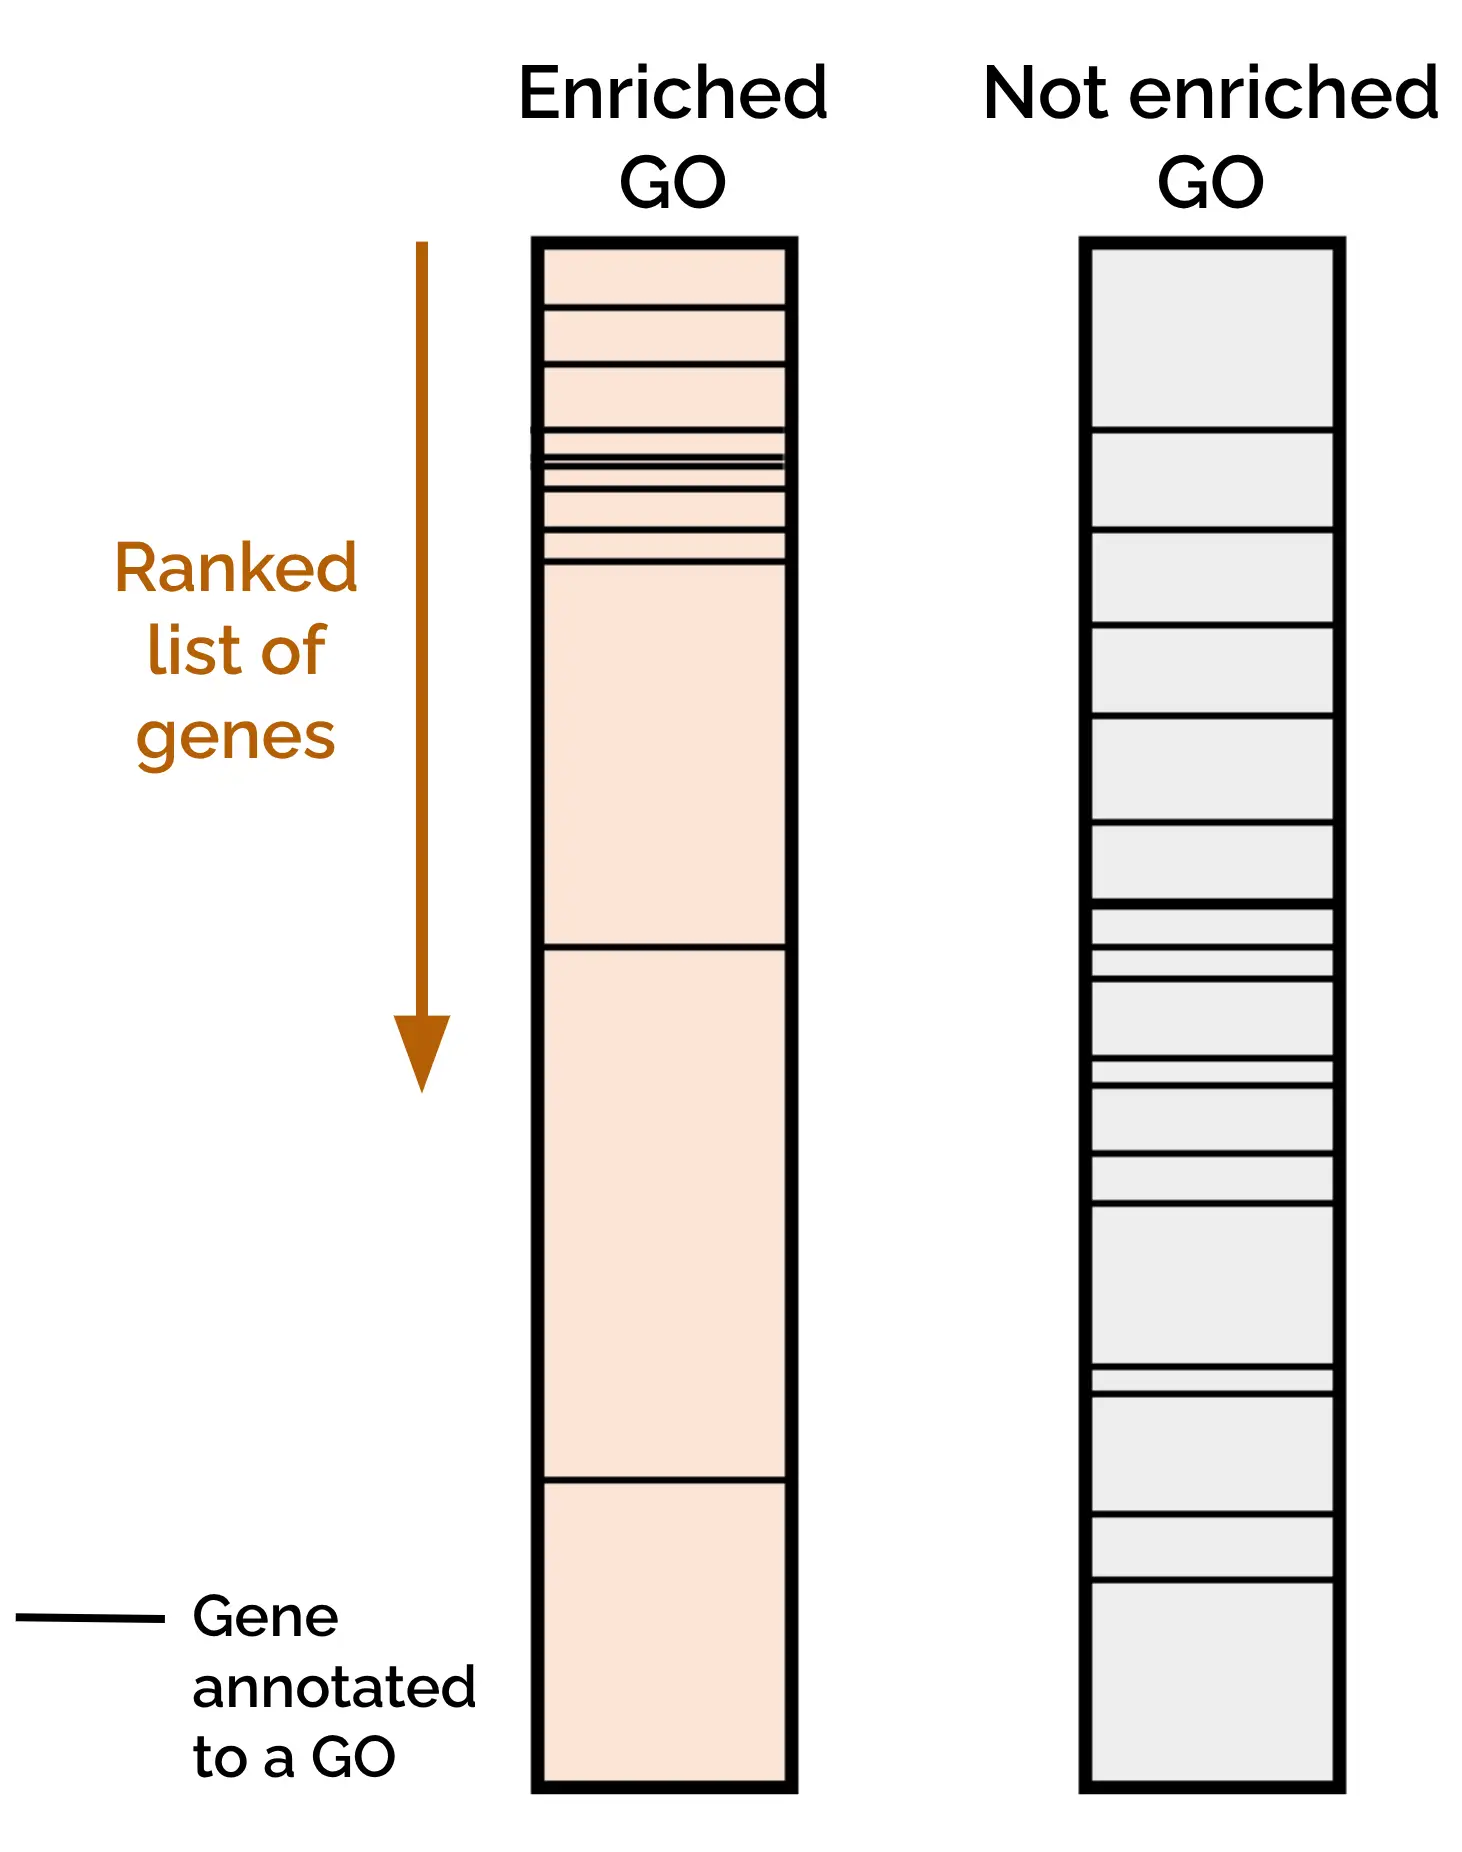
Gene Set Enrichment Analysis (GSEA) evaluates whether genes from a predefined “Gene Set” (such as those annotated to a specific GO term or pathway) tend to accumulate toward the top or bottom of a Ranked Gene List (Figure 2). This Ranked Gene List typically contains all the genes in a dataset with a biological metric associated, such as differential expression, methylation level, or any other continuous variable relevant to the study.
To apply GSEA in a differential expression context, a common ranking metric is: Rank = sign(log₂FC) × –log₁₀(P-value)
- The sign of the log₂ fold change (log₂FC) indicates the direction of regulation (positive for up-regulated, negative for down-regulated).
- The –log₁₀(P-value) reflects the statistical significance of the expression change, giving higher scores to more significant genes.
Using this formula, highly up-regulated genes with strong significance appear at the top of the list, while strongly down-regulated genes appear at the bottom. GSEA then tests whether genes from a given Gene Set are overrepresented at the top or the bottom part of the Ranked Gene List. For instance, if genes associated with a GO term are clustered at the top, that function is considered significantly enriched among up-regulated genes.
Conceptual and Practical Differences
When choosing between FET and GSEA, consider both the nature of your data and the biological question.
Dependence on Thresholds
- GSEA uses the full ranked list from differential‐expression analysis. There is no need to set arbitrary thresholds on fold change or p-value; every gene contributes to the enrichment score.
- FET, in contrast, requires two discrete lists: the test and the reference. To build the test set, you must apply thresholds, for example, when analyzing up genes from a differential expression analysis, by default, we would use some thresholds like log₂ FC > 1 or < –1 and FDR < 0.05. Therefore, the results will depend on those cutoffs.
Sensitivity to Subtle Signals
- GSEA is particularly powerful when changes are moderate but coordinated; that is, genes may rank near the top without exceeding strict cutoffs, yet collectively indicate enrichment.
- FET is more sensitive when you have a clear, non‐ambiguous list of genes of interest, for example, a small pathway signature or a list of genes identified by other criteria.
Use Cases
- GSEA is recommended for transcriptome-wide differential‐expression studies, since it avoids arbitrary gene selection thresholds and captures broad, coordinated shifts in expression.
- FET is ideal when you have a specific gene list (e.g., candidates from literature, knockout experiments) or no continuous ranking metric. It also runs faster on very large annotation databases due to simpler calculations.
How to run FET and GSEA in OmicsBox
In OmicsBox, Fisher’s Exact Test and Gene Set Enrichment Analysis are used to test for functional enrichment. They’re used to test if the genes annotated to GO terms are enriched in a given list of genes (FET) or in the upper or lower part of a ranked list of genes (GSEA). It is possible to launch them from the Side Panel of a Functional Annotation Project for more general purposes, or from the Side Panel of Differential Expression Results.
From Functional Annotation Results
A Functional Annotation OmicsBox project contains gene names or sequence IDs and the GOs linked to them (Figure 3). This file should contain all the sequences present in your analysis, not only the ones to test for enrichment, since this project will be the reference or background.
This project can be obtained by directly downloading it from BioMart with the tool in functional analysis > Load > Load Data from BioMart. It can also be obtained from scratch with the Blast2GO pipeline, which comprises the BLAST > GO Mapping > GO Annotation steps. In addition, InterProScan and EggNOG may be run as well.
The Fisher’s Exact Test can be accessed in the project’s Side Panel > Functional Analysis > Enrichment Analysis > Fisher’s Exact Test. This will automatically use all the genes present in the project as the reference list, but an alternative reference list can also be provided in the configuration wizard. The test list can be specified either in a text file containing one gene per line or an OmicsBox ID-list file.
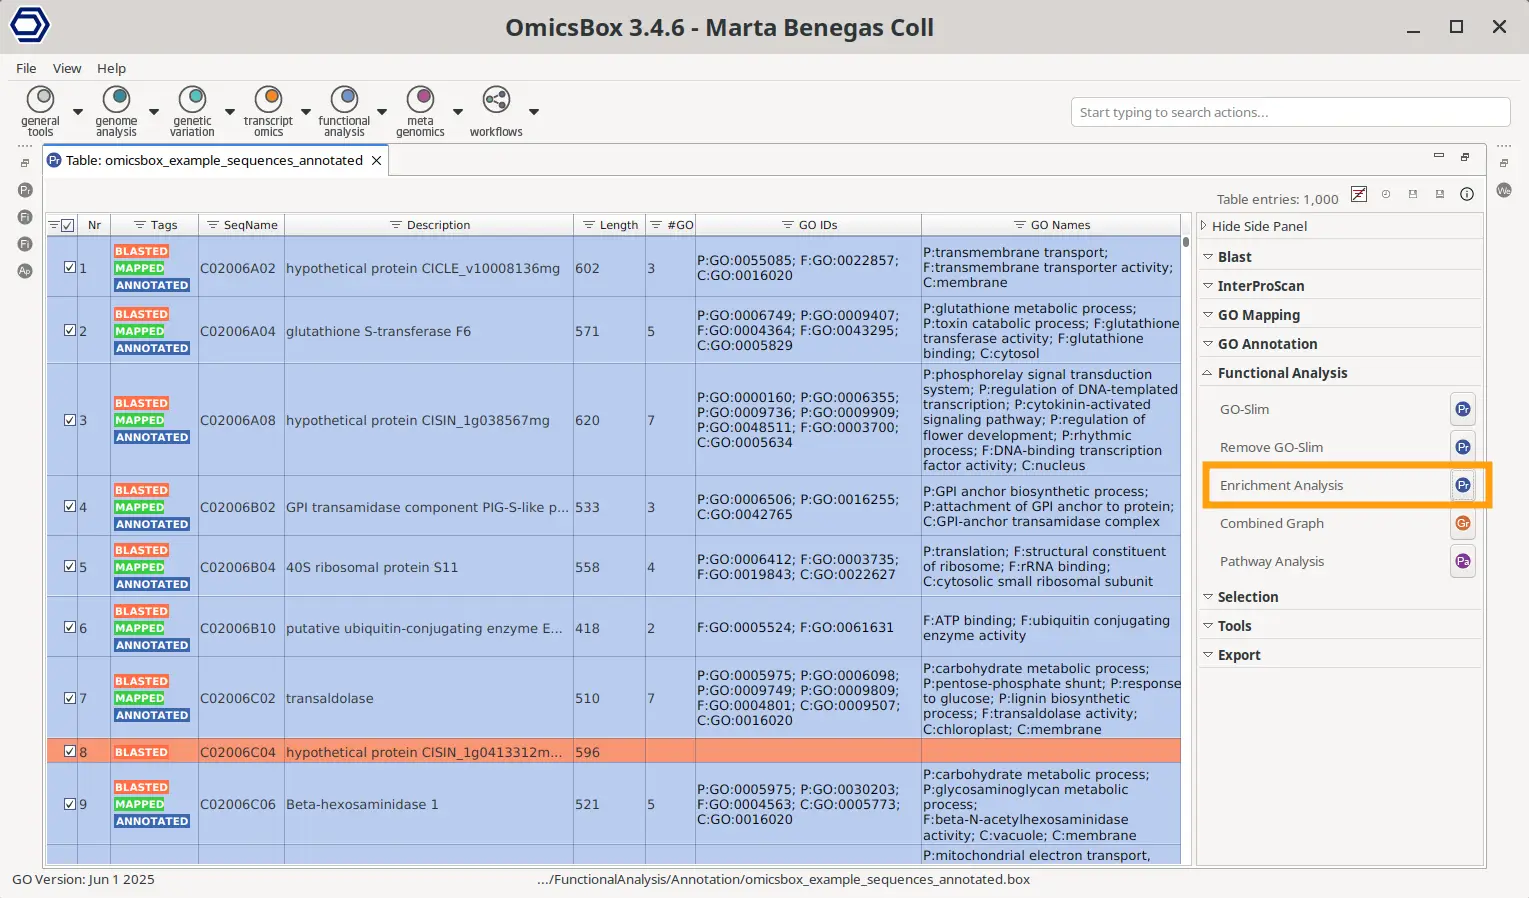
The Gene Set Enrichment Analysis can be accessed in the project’s Side Panel > Functional Analysis > Enrichment Analysis > Gene Set Enrichment Analysis. It is mandatory to provide the ranked gene list, either in a text file with two tab-delimited columns (gene name/IDs and metric) or an OmicsBox ID-value list.
From Differential Expression Results
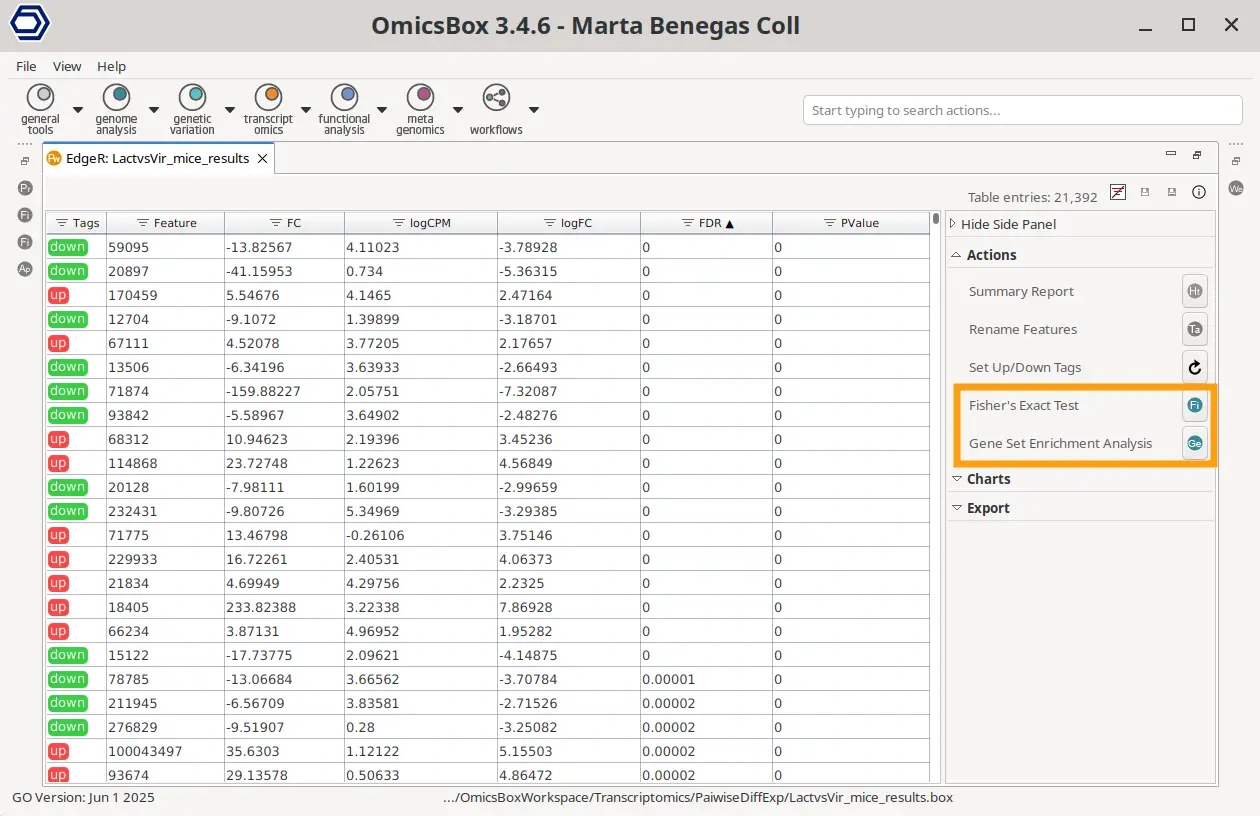
Both FET and GSEA tests are available in the Side Panel of almost all the different Differential Expression (DE) analysis results available in OmicsBox (Pairwise, Pairwise Without Replicates, Timecourse, and scRNA-Seq DiffExp). Both analyses will need an OmicsBox Functional Annotation project (Figure 3) as a reference, which can be obtained with the two methods explained above.
The Fisher’s Exact Test is available in the object’s Side Panel > Actions > Fisher’s Exact Test. In this case, the test gene list is automatically obtained from the Differential Expression results. Depending on the type of DE analysis, this test list consists of the up- or down-regulated genes or the gene clusters for timecourse analysis.
The Gene Set Enrichment Analysis is located in the object’s Side Panel > Actions > Gene Set Enrichment Analysis. In the results where it’s available, the metric to rank the genes is obtained automatically from the DE statistics with the formula: Rank = sign(logFC) * -log10(P-Value).
About the Author
 Marta Benegas
 studied biotechnology at the Valencia Polytechnic University (UPV) and continued her studies with a Master's in Bioinformatics at the Autonomous University of Barcelona (UAB), Spain. After her master's degree, she started her professional career at Biobam where she is now working as a bioinformatics specialist and support manager.
At the moment she is mainly focused on Single-Cell technologies developing various pipelines which allow getting from reads to functional insights at a single-cell resolution. These developments are available in OmicsBox, BioBam’s software solution.
Marta Benegas
Marta Benegas studied biotechnology at the Valencia Polytechnic University (UPV) and continued her studies with a Master's in Bioinformatics at the Autonomous University of Barcelona (UAB), Spain. After her master's degree, she started her professional career at Biobam where she is now working as a bioinformatics specialist and support manager.
At the moment she is mainly focused on Single-Cell technologies developing various pipelines which allow getting from reads to functional insights at a single-cell resolution. These developments are available in OmicsBox, BioBam’s software solution.
")
