How to know if all your sequences have been analyzed
The Analysis Progress chart is a very useful representation, which shows the step of the analysis in which the sequences in your dataset are found.
They can be in different states, each represented by a color:
-
- Total: grey
- Without Analysis: white
- With IPS: purple
- With Blast Hits: orange
- Without Blast Hits: red
As an example of the utility of the Progress chart, the analysis progress may allow you to detect that not all your sequences have been analyzed at a specific step in the analysis due to any kind of problem. In the current entry, you will learn how to detect the problem and solve it.
|
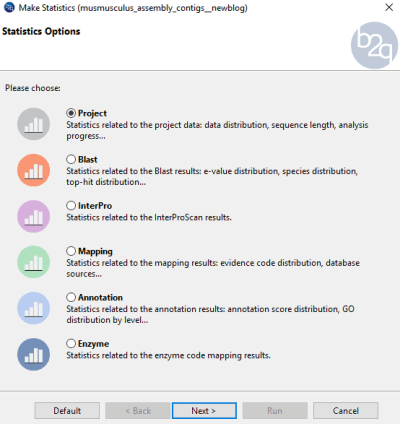
The Analysis Progress can be represented in the “Charts” menu, by selecting the “Project” statistics.
|
|
|
A progress chart as the one bellow may reveal that there are some sequences that have not been analyzed with IPS.
|
|
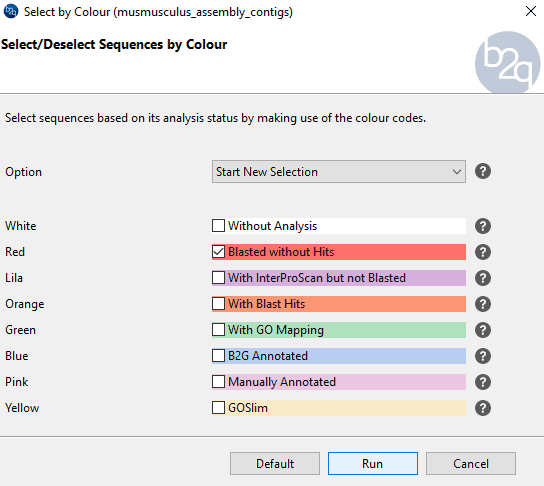
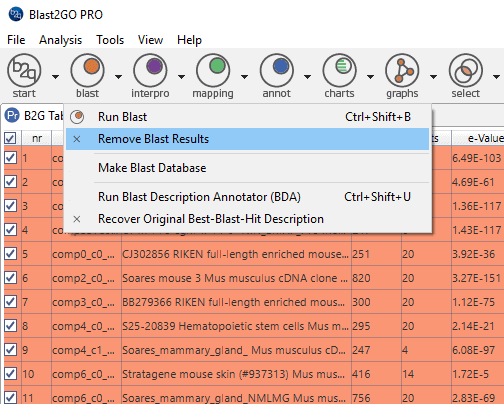
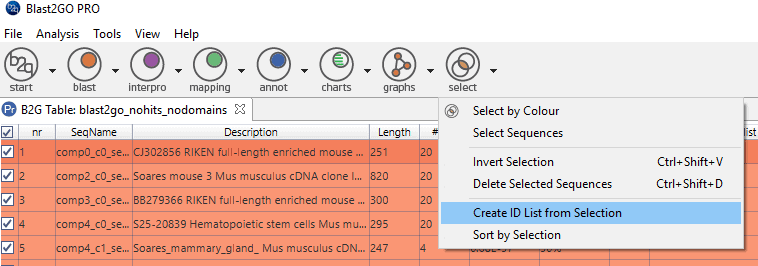
Now you have the sequences that are not analyzed selected. Run IPS again and confirm, with the Analysis Progress chart that indeed all the sequences have been analyzed.
