Accurate cell type prediction is a crucial step in the interpretation of single-cell RNA-seq data, as downstream biological insights strongly depend on these predictions. However, most annotation strategies rely on an initial unsupervised clustering step that is sensitive to parameter choices, thus leading to substantial variation in cell grouping.
While it is widely acknowledged that clustering quality influences downstream analyses, the extent to which “good quality” clusterings truly translate into better annotation outcomes remains insufficiently characterized. The question of whether researchers should trust clustering metrics alone to select the “best” clustering for downstream analysis is yet unanswered, as well as which would be a good set of metrics to define the quality of a clustering.
With this problem in mind, we presented the poster entitled “The Influence of Clustering Quality on Cell Type Prediction Accuracy” at the ISMB/ECCB conference in 2025. This study explores the relationship between clustering quality and cell type prediction accuracy. By comparing multiple clustering outputs of varying quality against ground-truth annotations, we evaluate whether commonly used clustering metrics align with annotation performance.
The full poster can be downloaded here.
Data availability
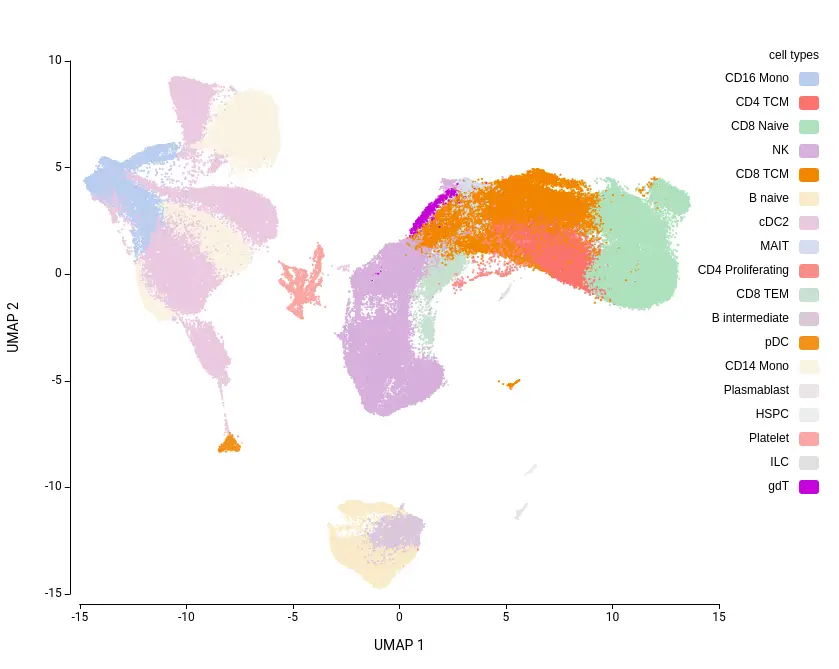
The dataset used for the analysis was the Human PBMC reference from the Azimuth database[1]. This dataset consists of approximately 162,000 cells, annotated into 31 cell types and 8 broad cell types. As it includes well-curated cell type labels, it provides a suitable ground truth for evaluating prediction accuracy.
For the cell type prediction step, we used the ScaleBio Human Blood reference dataset[2], available via the CellXGene database[3]. This dataset comprises around 685,000 cells with high-quality annotations, covering 26 cell types and 8 broad cell types—all of which are also present in the Azimuth dataset, thus eliminating the need for additional cell type mapping.
Bioinformatics Analysis
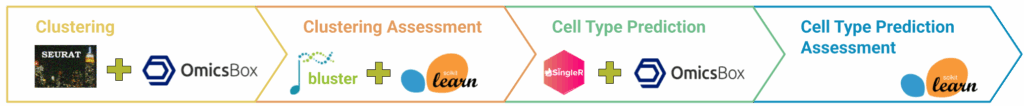
In order to perform the analysis (Figure 1), a range of different clusterings was obtained by tuning two key parameters. Clustering quality was assigned based on widely used metrics. For each clustering, cell type annotation was performed by assigning a label to each cluster. To assess the quality of the prediction, commonly used metrics were used. Prediction accuracy was then assessed using standard evaluation metrics. Finally, the relationship between clustering quality and prediction performance was analyzed.
Clustering
Clusterings were performed using the OmicsBox Seurat[4] implementation. Since the dataset was already filtered and integrated, no additional preprocessing was required. All remaining preprocessing parameters were left at their default settings.
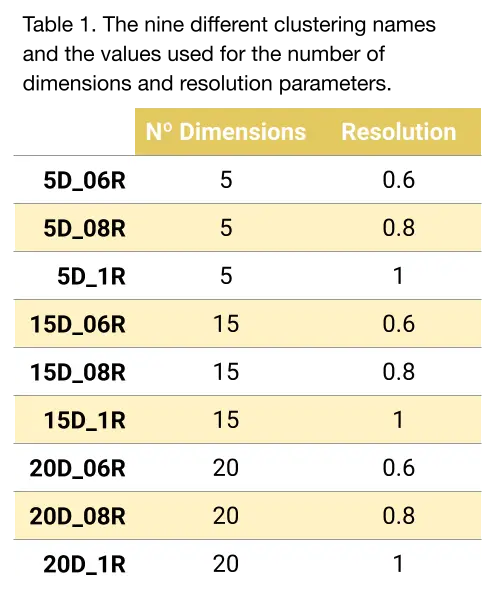
Regarding the clustering, it was performed using the Seurat default graph-based Louvain algorithm. All parameters were left by default except two (Table 1):
- Number of dimensions (principal components) used for clustering. This translates to the “amount of data” used for clustering.
- Resolution parameter of the Louvain graph-based clustering algorithm, which models how granular the partitions should be.
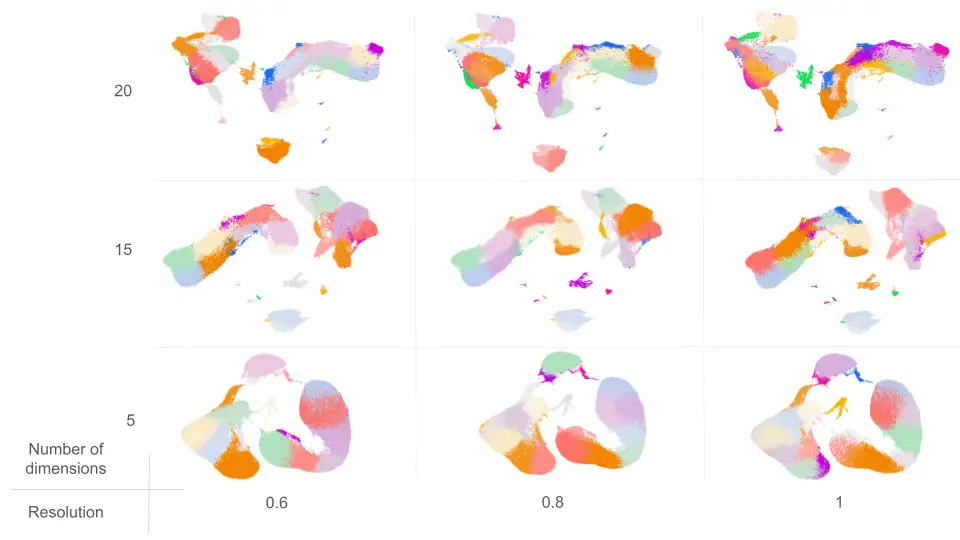
With this setup, a total of 9 different clusterings were obtained (Figure 2)
Clustering Assessment
The clustering quality was assessed using the bluster[5] R package, available through Bioconductor. The following metrics were used:
- Silhouette and Purity: to assess the intra-cluster cohesion and inter-cluster separation.
- Root Mean Square Deviation (RMSD): to measure the compactness of cells within clusters. Higher RMSD values may indicate intra-cluster substructure, suggesting the potential for further subdivision.
To reduce computational cost, metrics were calculated on the first 50 principal components rather than raw counts. Since the metrics are computed per cell, the final value for each clustering was obtained by averaging across clusters, each of which had been averaged across their constituent cells.
Additionally, to assess how well the cluster structure aligned with known cell types, the Adjusted Rand Index (ARI) was computed using the scikit learn[6] Python package. While ARI relies on ground-truth labels (and thus wouldn’t be available in typical real-world scenarios), it was included here to validate the reliability of the clustering metrics. A detailed description of the metrics can be found here.
Cell Type Prediction
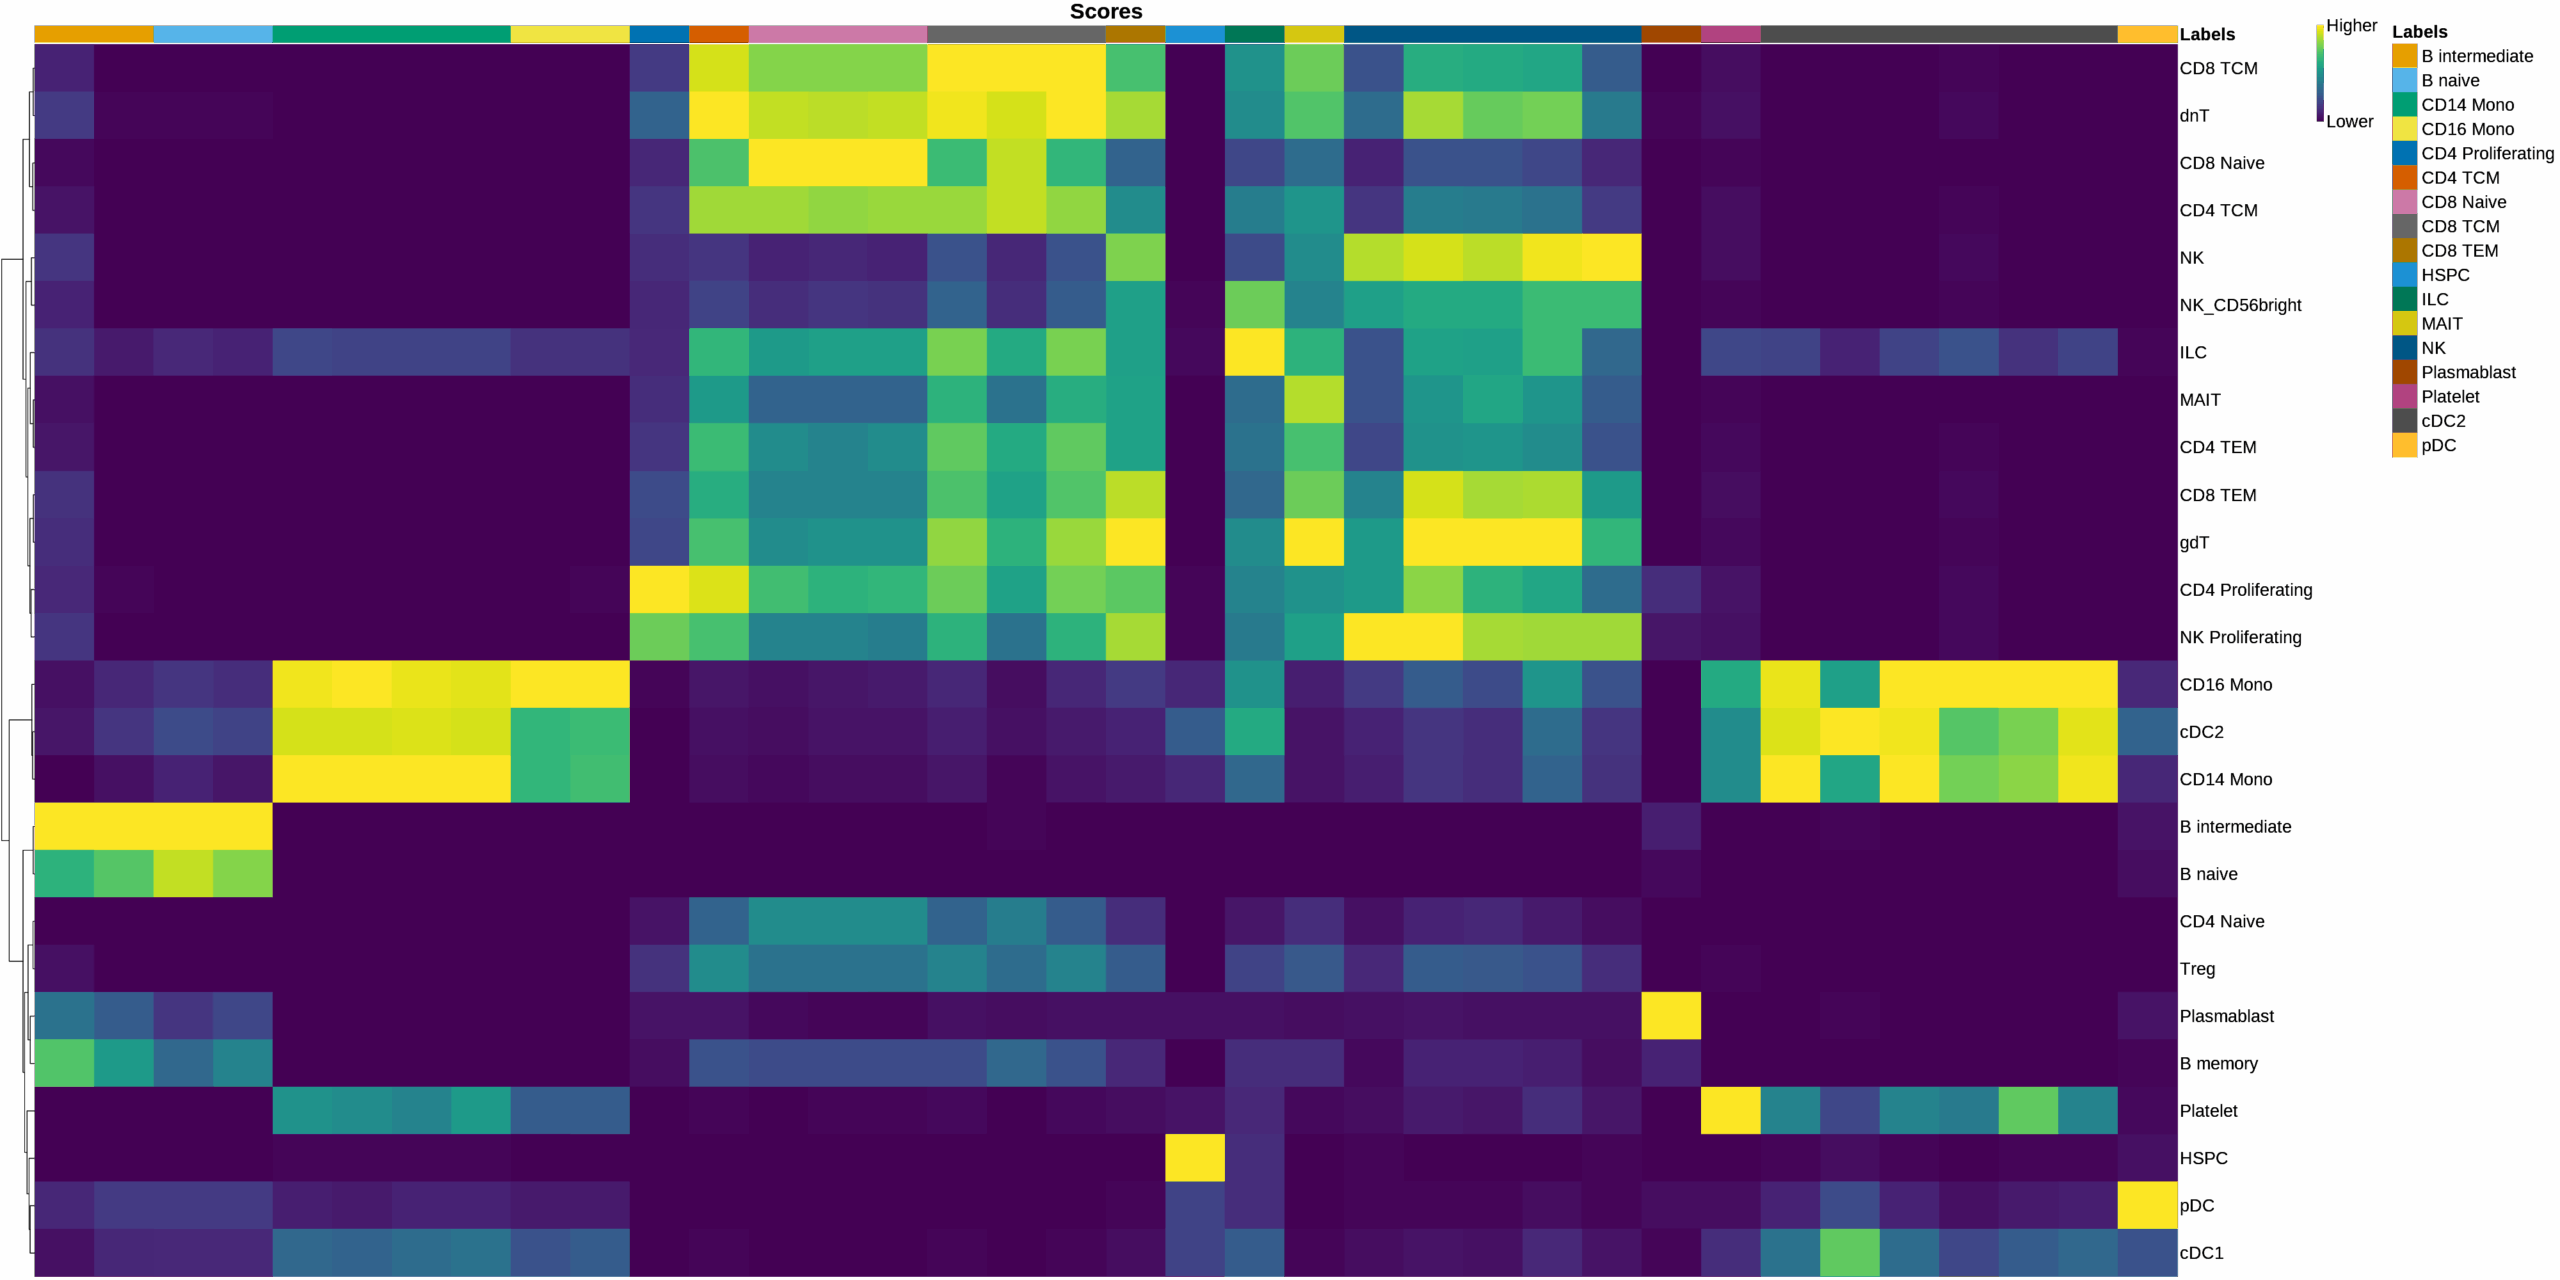
Cell type labels were assigned for each cluster using the OmicsBox SingleR[7] implementation. The reference used was the one explained in the Data Availability section. Annotation was performed using both Level 1 (broad) and Level 2 (granular) reference cell type labels. All other parameters were kept at their default values.
Cell Type Prediction Assessment
Prediction accuracy was evaluated by comparing predicted labels against the known ground truth. Several metrics from the scikit learn[6] package were used. The Accuracy was used to measure the overall correctness of predictions. The Precision, Recall, and F1-Score were computed to assess the class-wise prediction performance. Finally, the Cohen’s Kappa and the Matthews Correlation Coefficient (MCC) metrics were computed to measure the agreement between labelings beyond chance, accounting for class imbalance and prediction reliability.
Because Precision, Recall, and F1-Score are computed per class, average values were calculated to summarize performance across all cell types. The Macro Average simply calculates the mean of each metric, giving equal weight to each class. Thus, macro-averaging highlights the prediction performance on rare cell types. The Weighted Average accounts for class imbalance by weighting each class’s score based on its frequency in the true data sample. Detailed metrics explanation
Results
Clustering Assessment
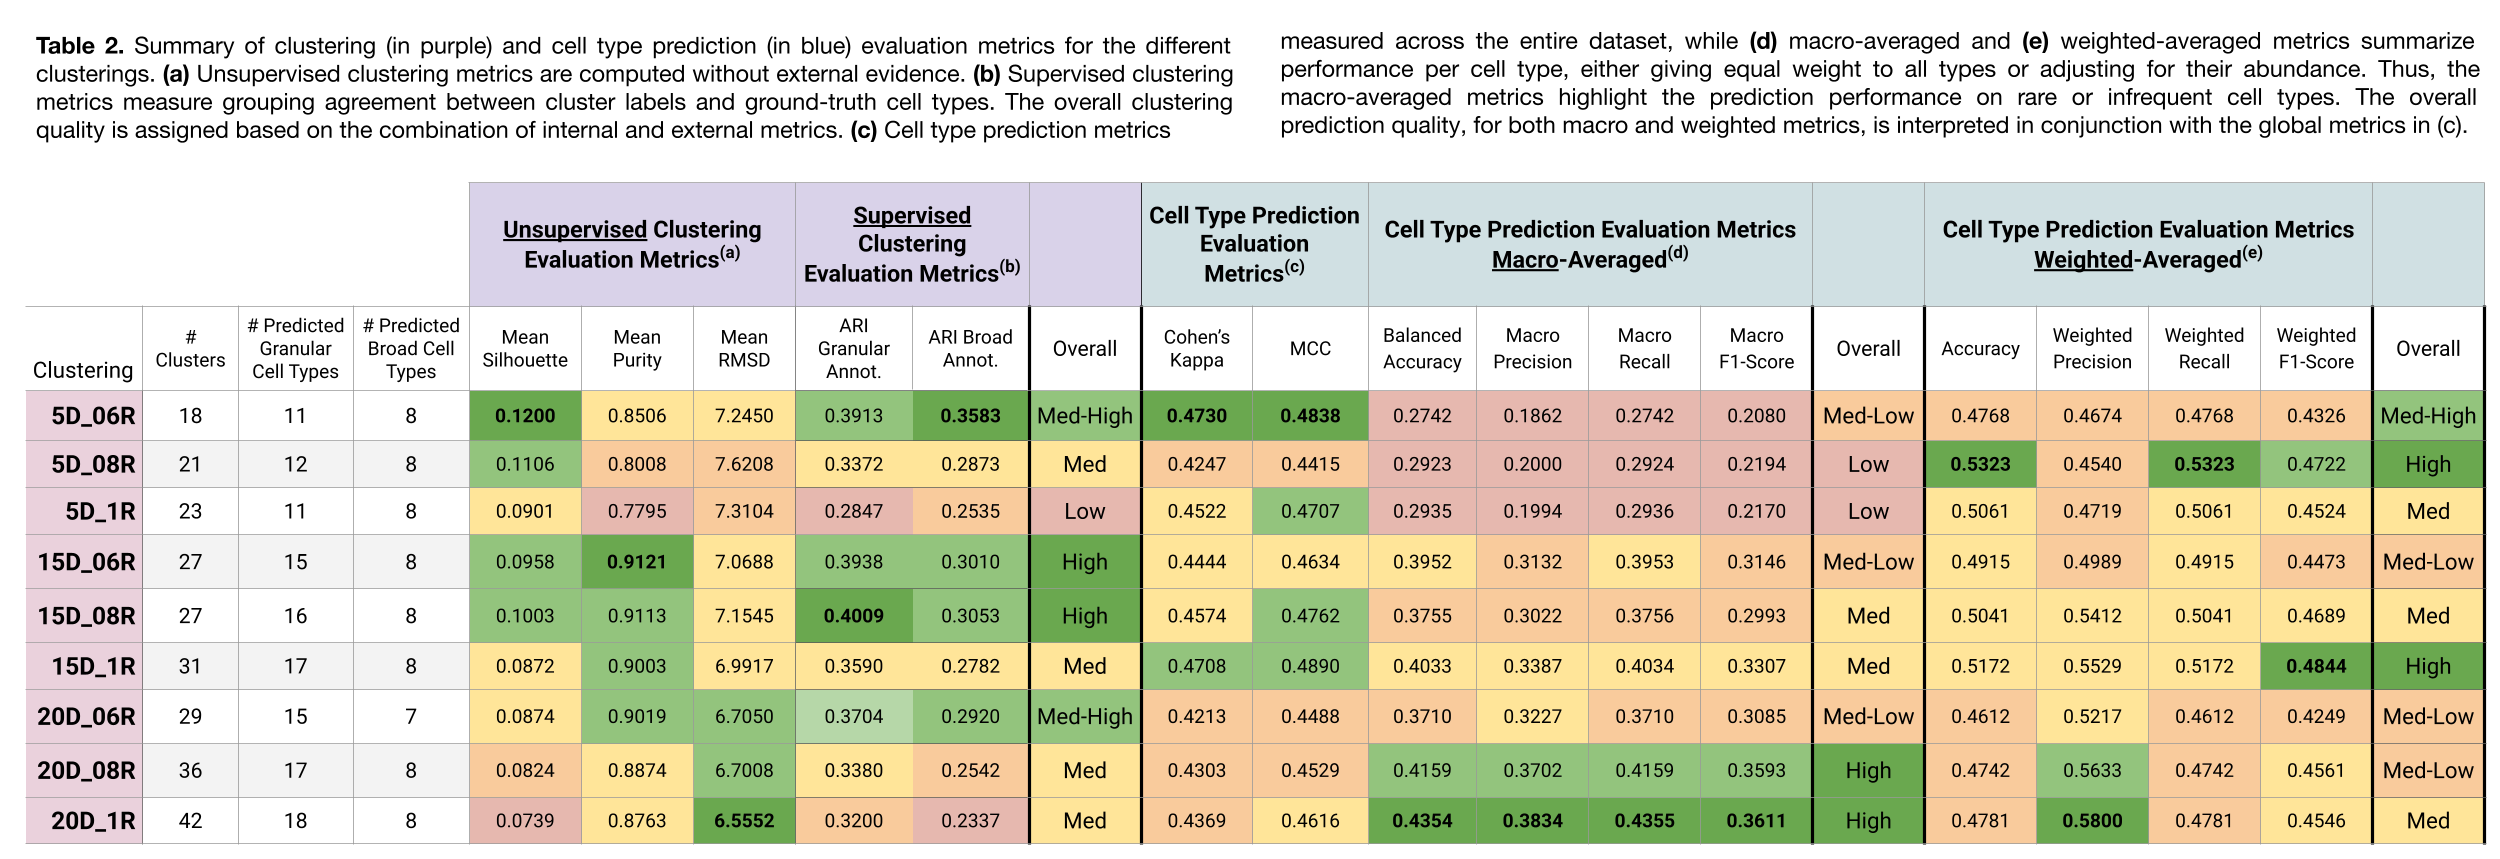
Clusterings with a higher number of partitions (e.g., 20D_1R and 20D_08R) exhibited the following:
- Lower Silhouette and Purity scores, indicating less distinct and more intermingled clusters.
- Lower RMSD, suggesting that the clusters do not have internal substructure.
- Lower ARI, reflecting poorer alignment with ground-truth labels. However, it’s important to note that ARI penalizes over-clustering, that is, when a clustering has more groups than the reference labels, placing similar cells into different clusters results in a lower ARI score, even if their cell type predictions are correct.
In contrast, clusterings with fewer partitions (e.g., 5D_06R and 5D_08R) showed:
- Higher Silhouette and Purity scores, reflecting more distinct, well-separated clusters.
- Higher RMSD, suggesting potential substructure and the possibility of further partitioning.
- Higher ARI, indicating better agreement with the original annotations.
Cell Type Prediction Assessment
Clusterings with more partitions (e.g., 20D_1R, 20D_08R) were more effective at detecting rare cell types, as shown by stronger performance in macro-averaged metrics.
In contrast, clusterings with fewer partitions were better at capturing broad cell type structure, as indicated by stronger weighted-average, Cohen’s Kappa, and MCC scores.
It is also worth noting that, despite using a similar reference dataset, the maximum number of distinct predicted cell types was 18 (in the 20D_1R clustering), compared to the 31 annotated in the ground truth. This highlights the challenge of detecting highly specific cell types that may not be well-represented in the reference or query datasets.
Conclusions
As shown in Table 3, there is no direct correlation between clustering quality and a good cell type prediction performance. Each clustering configuration offers different insights, making it difficult to define a single “best” clustering based on metrics alone.
However, clustering quality metrics are valuable for understanding the type of clustering being analyzed and for comparing different configurations. For example:
- High RMSD values can indicate more granular clusterings, which are useful for identifying rare cell types but may also include spurious groupings.
- High Silhouette and Purity scores suggest well-defined cluster boundaries.
We recommend running multiple clustering configurations to explore the data from various angles and combining insights from multiple sources. We suggest starting with a well-defined clustering (based on Silhouette and Purity) and then enrich it by integrating information from higher-resolution clusterings (with more partitions and higher RMSD). Once an initial annotation is obtained, it’s good practice to sub-cluster larger groups or broad cell types to uncover finer subpopulations. This annotation refinement workflow and data exploration can be easily performed in OmicsBox, and a detailed example of this process is available at the end of this blog post.
References
- Hao, Y., Hao S, Andersen-Nissen E, et al. (2021) ‘Integrated Analysis of multimodal single-cell data’, Cell, 184(13). doi:10.1016/j.cell.2021.04.048.
- ScaleBio Single Cell RNA Sequencing of Human PBMCs [dataset]. (n.d.). CZ CELLxGENE Discover. Retrieved July 2025, from Cellxgene Data Portal
- CZ CELLxGENE Discover: A single-cell data platform for scalable exploration, analysis and modeling of aggregated data CZI Single-Cell Biology, et al. bioRxiv 2023.10.30; doi:10.1101/2023.10.30.563174
- Hao, Y., Stuart, T., Kowalski, M.H. et al (2024). ‘Dictionary learning for integrative, multimodal and scalable single-cell analysis’. Nat Biotechnol 42, 293–304. doi:/10.1038/s41587-023-01767-y
- Lun A (2025). ‘bluster: Clustering Algorithms for Bioconductor’. doi:10.18129/B9.bioc.bluster, R package version 1.18.0, bluster .
- Pedregosa et al. (2011). ‘Scikit-learn: Machine learning in Python’. Journal of Machine Learning Research, 12, pp.2825–2830.
- Aran, D., Looney AP, Liu L, et. al. (2019). ‘Reference-based analysis of lung single-cell sequencing reveals a transitional profibrotic macrophage.’ Nat. Immunol., 20, 163-172. doi:10.1038/s41590-018-0276-y.
About the Author
 Marta Benegas
 studied biotechnology at the Valencia Polytechnic University (UPV) and continued her studies with a Master's in Bioinformatics at the Autonomous University of Barcelona (UAB), Spain. After her master's degree, she started her professional career at Biobam where she is now working as a bioinformatics specialist and support manager.
At the moment she is mainly focused on Single-Cell technologies developing various pipelines which allow getting from reads to functional insights at a single-cell resolution. These developments are available in OmicsBox, BioBam’s software solution.
Marta Benegas
Marta Benegas studied biotechnology at the Valencia Polytechnic University (UPV) and continued her studies with a Master's in Bioinformatics at the Autonomous University of Barcelona (UAB), Spain. After her master's degree, she started her professional career at Biobam where she is now working as a bioinformatics specialist and support manager.
At the moment she is mainly focused on Single-Cell technologies developing various pipelines which allow getting from reads to functional insights at a single-cell resolution. These developments are available in OmicsBox, BioBam’s software solution.
")
