Accurate cell type prediction is a key step in single-cell RNA-seq (scRNA-seq) analysis, as downstream biological interpretations strongly depend on the quality of these predictions. However, most cell annotation strategies start with an unsupervised clustering step, where parameter choices can substantially affect the resulting cell groupings. Different clustering configurations may reveal distinct biological insights, making it important to evaluate and compare them systematically.
To address this, OmicsBox now incorporates clustering quality assessment metrics directly into the single-cell analysis module. These metrics help users understand how well cells are grouped and provide a quantitative basis for comparing alternative clustering results.
As demonstrated in our recent ISCB/ECCB 2025 poster, clustering quality metrics can reveal the nature of a clustering. They help elucidate whether it captures broad cell types, finer subpopulations, or potential artifacts, rather than defining a single “best” solution. By combining these metrics, users can better interpret the structure of their data and make informed decisions about which clustering configurations to explore further.
Clustering Quality Assessment Metrics
Clustering quality in OmicsBox is evaluated using the bluster R package (Bioconductor). Three complementary metrics are calculated for each clustering: Silhouette, Purity, and Root Mean Square Deviation (RMSD). Together, they provide an overview of cluster cohesion, separation, and internal compactness.
Silhouette Score
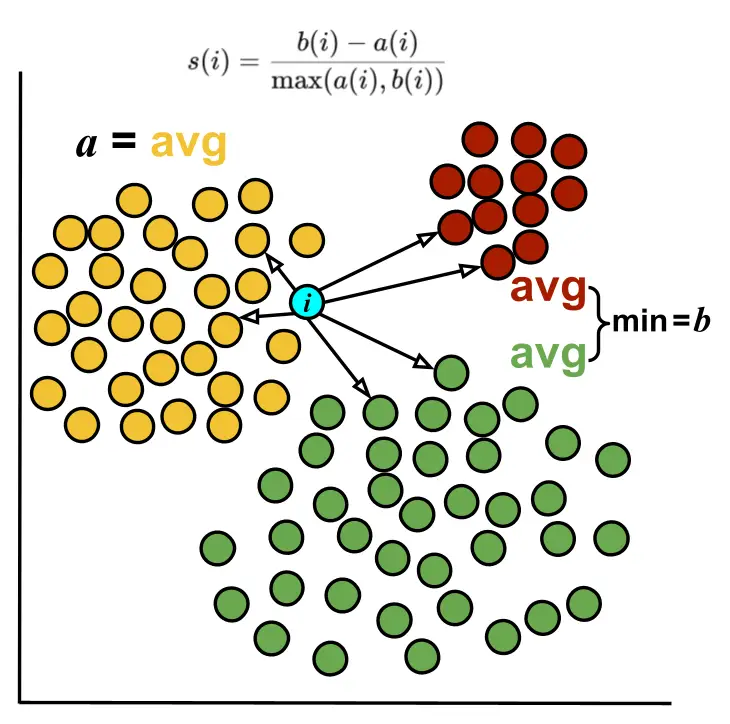
The Silhouette score measures how similar a cell is to its own cluster compared to other clusters. It is computed per cell by comparing the average distance to all other cells in the same cluster to the minimum average distance to cells in other clusters. It ranges from -1 to 1. Higher scores indicate cells well-matched to their cluster.
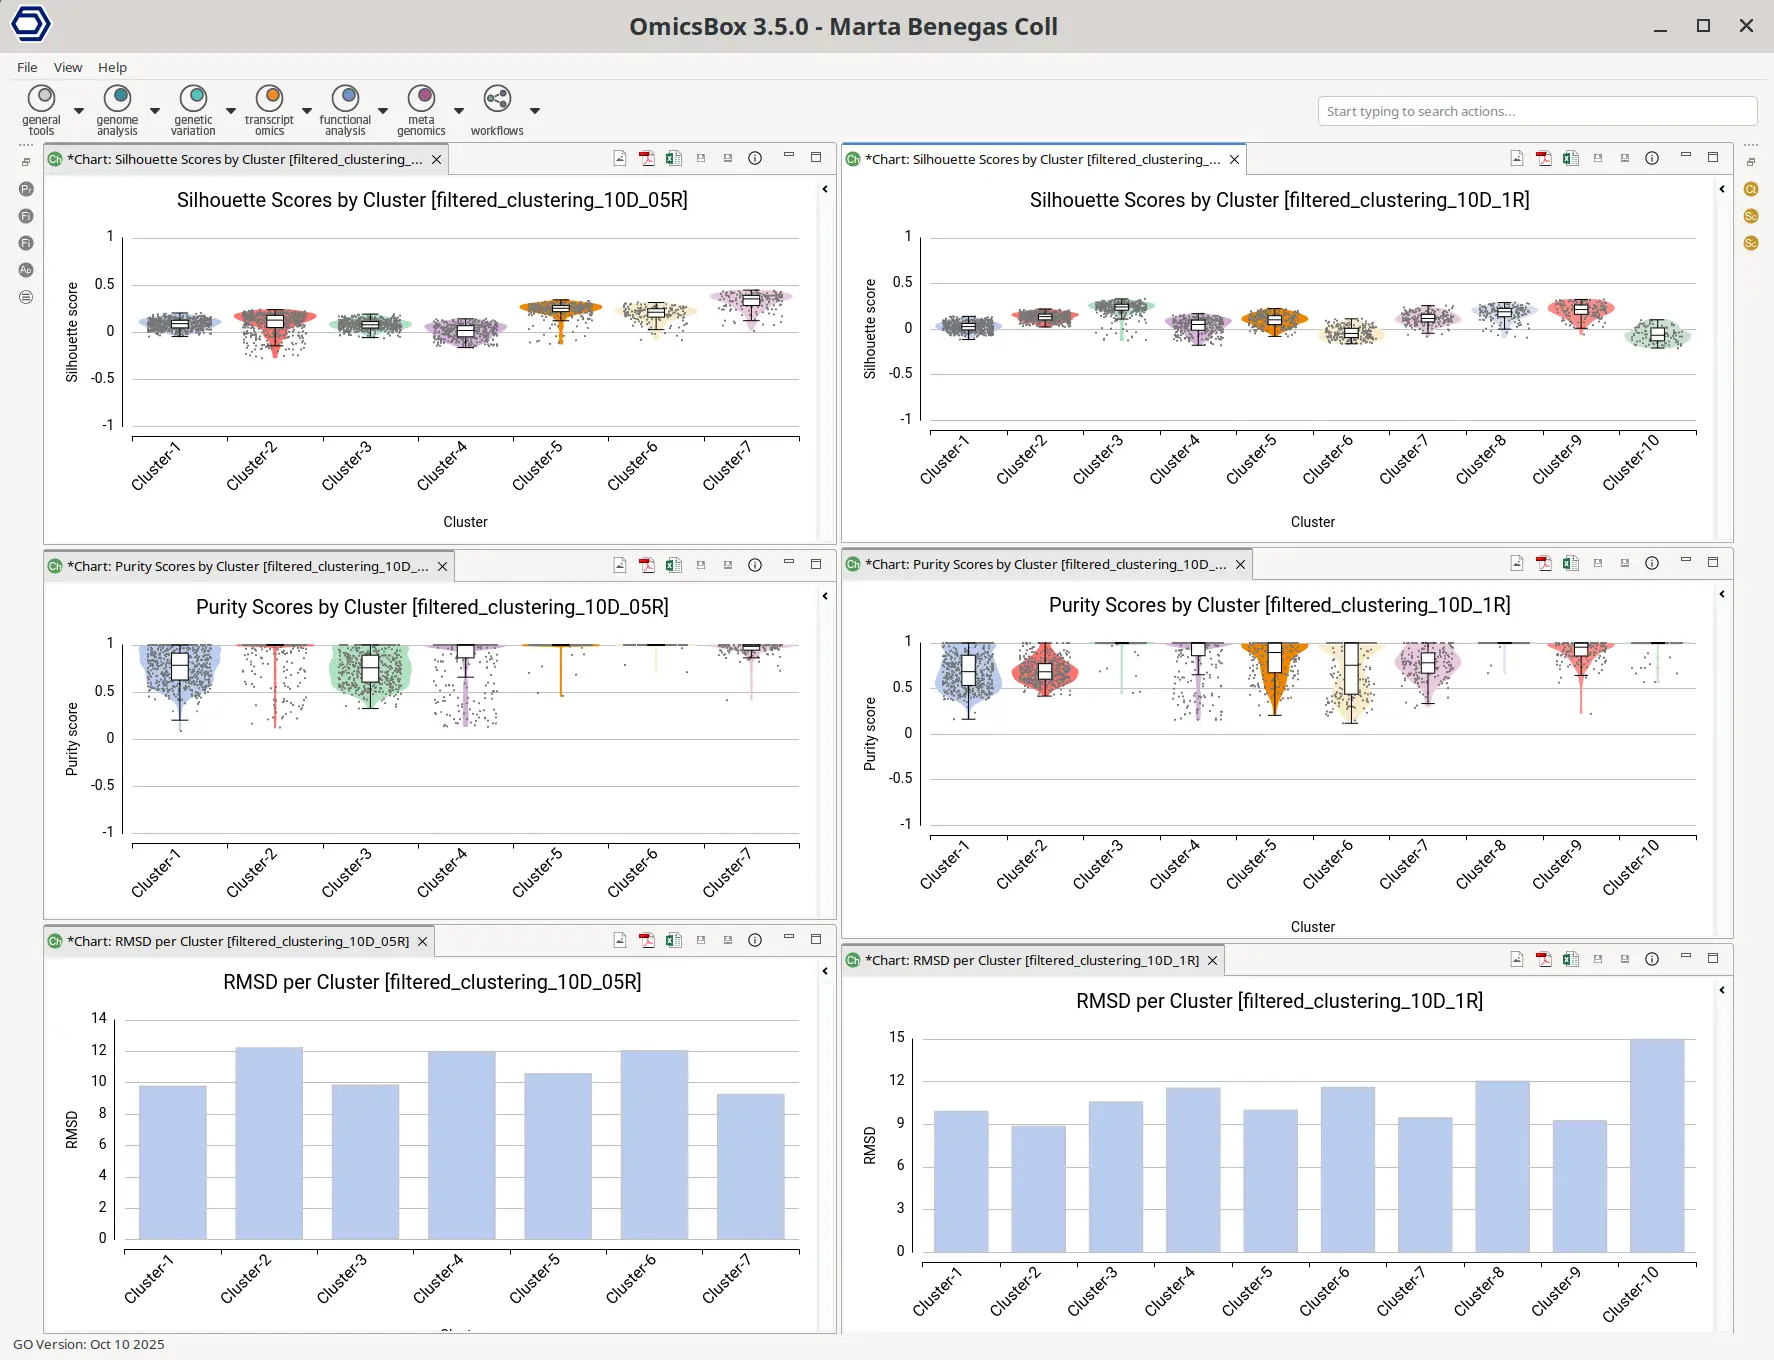
In OmicsBox, Silhouette scores per cluster are displayed as violin plots, overlaid with a box plot summarizing the median, interquartile range, and outliers
Cluster Purity
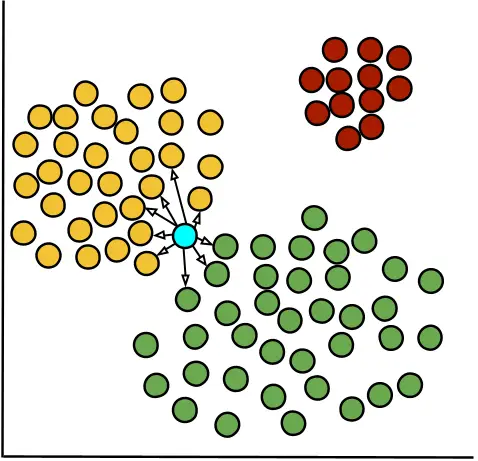
Purity quantifies the homogeneity of each cluster by assessing the proportion of a cell’s nearest neighbors that belong to the same cluster. The Purity Score for each cell is the proportion of its nearest neighbors that belong to the same cluster. It ranges from -1 to 1. Higher scores indicate more homogeneous clusters.
Purity scores per cluster are shown as violin plots with a box plot overlay, providing both the overall distribution and summary statistics for each cluster.
Root Mean Square Deviation (RMSD)
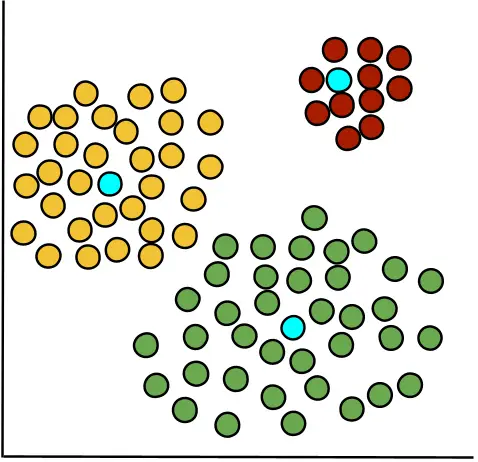
RMSD measures the average distance between cells within a cluster and their cluster center, reflecting how tightly cells are grouped. It is computed by measuring the squared distance of each cell from the cluster centroid (highlighted in blue), averaging these values, and then taking the square root. Lower RMSD values indicate compact, well-defined clusters, while higher values suggest more dispersed clusters with potential substructure.
Since RMSD is computed per cluster rather than per cell, it is represented as a bar chart in OmicsBox.
Bioinformatic Analysis
Dataset
We used the same dataset as in Seurat’s Clustering Vignette, which contains 2,700 Human Peripheral Blood Mononuclear Cells (PBMCs). The dataset is provided by 10x Genomics, and its raw expression matrix can be downloaded from here. The MTX gene expression matrix was imported into OmicsBox via Transcriptomics → Load → Load Single Cell RNA-Seq Count Matrix, selecting the “Matrix Market File” option.
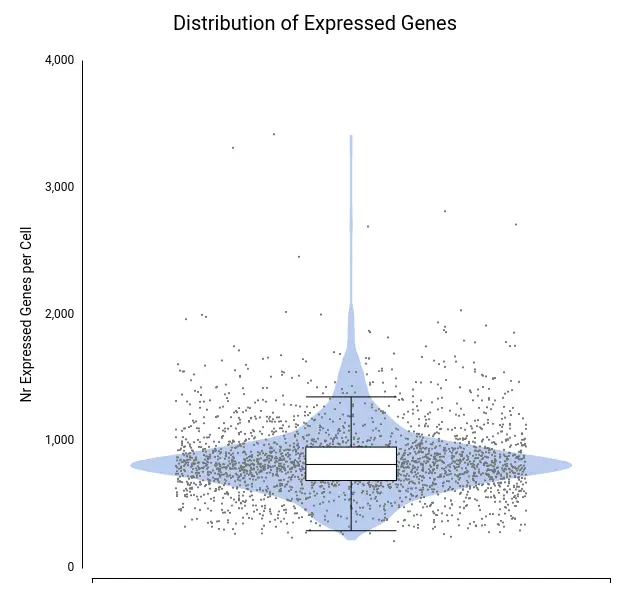
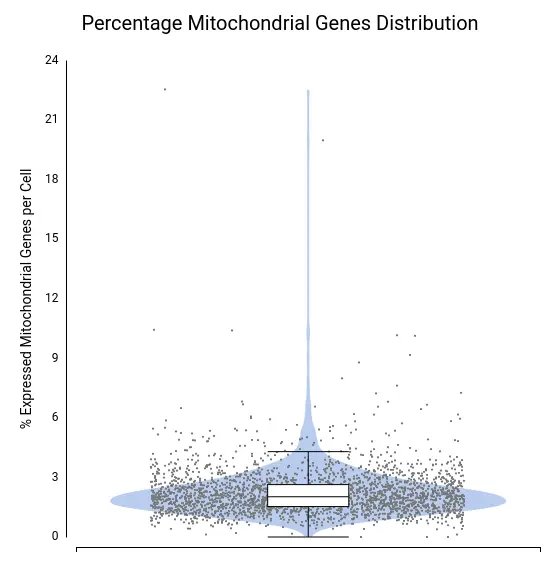
To assess data quality, we examined the distributions of total counts per cell, number of expressed genes per cell, and percentage of mitochondrial genes per cell (Figures 4–6).
A few cells showed unusually high values for both total counts (Figure 4) and number of expressed genes (Figure 5), likely representing doublets or multiplets. It is recommended to remove these cells from the dataset to prevent misleading expression profiles. Additionally, some cells exhibited a high mitochondrial gene percentage (Figure 6), suggesting low-quality or dying cells.
Filtering was performed using the Filtering tool in OmicsBox to remove cells with more than 6,000 total counts, 2,000 expressed genes, or 7% mitochondrial content. Genes expressed in fewer than 100 cells were also discarded to reduce noise and computational load. After filtering, the dataset contained 38 fewer cells and 27,980 fewer genes, improving overall data quality.
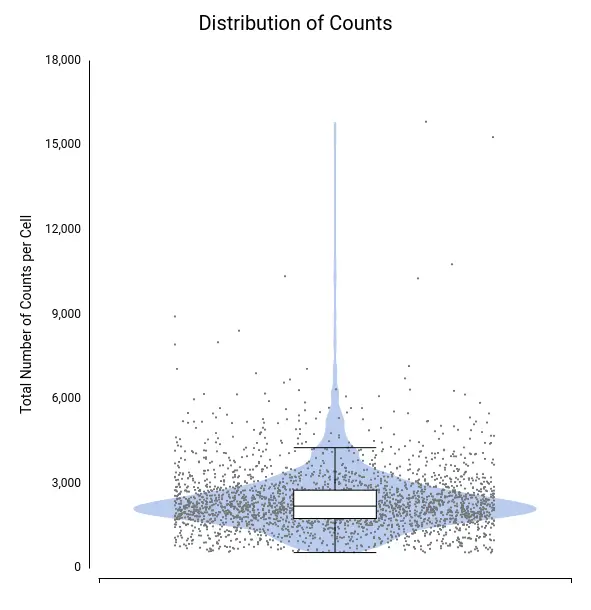
Each dot corresponds to a cell, with the violin shape showing the density of cells along the y-axis and the box plot providing summary statistics.
Clustering
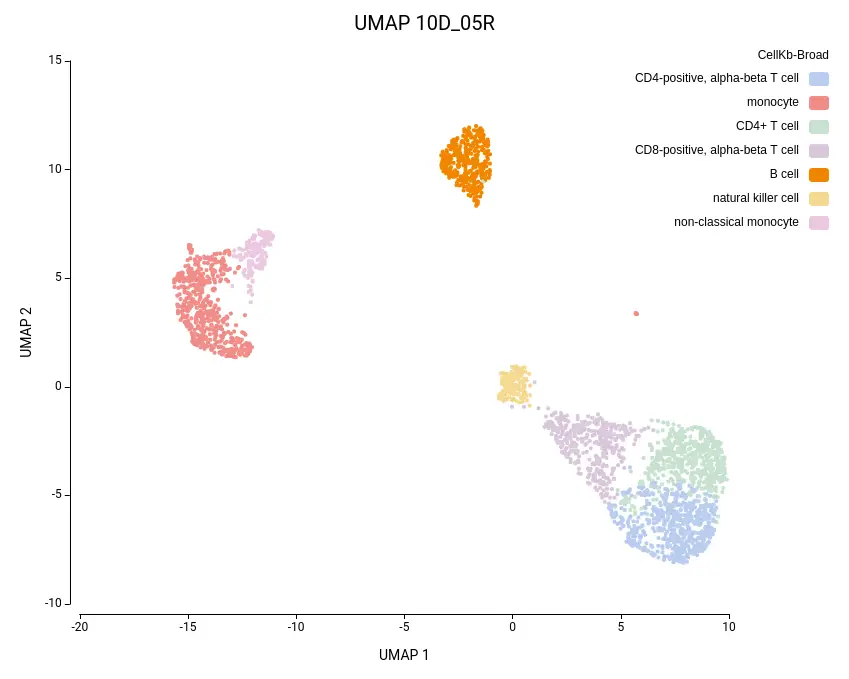
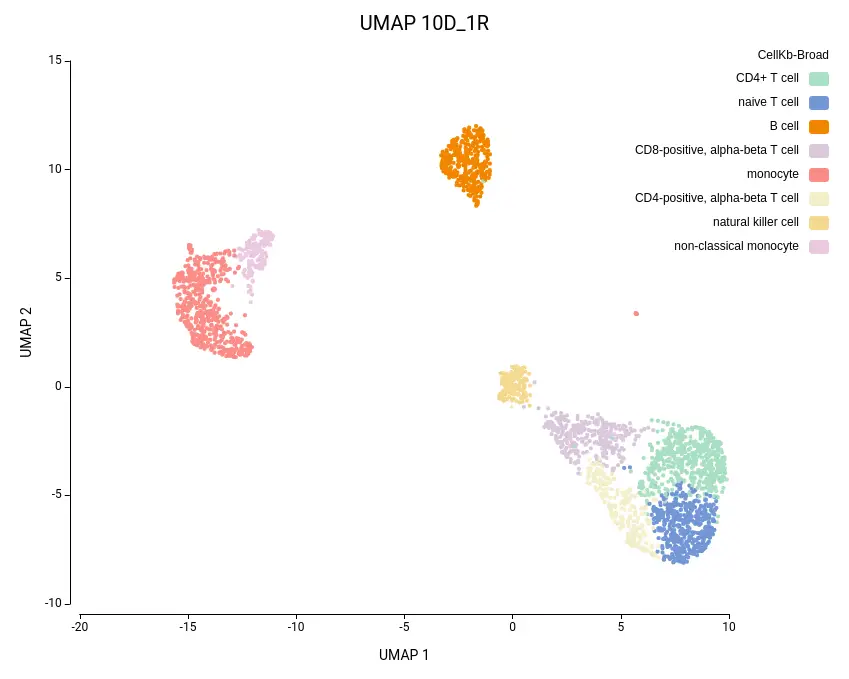
Cell clustering was performed using the Seurat implementation in OmicsBox. We followed the parameters from Seurat’s vignette, using 10 dimensions for clustering and a resolution of 0.5, and ran an additional clustering at resolution 1.0 to explore finer subpopulations. From now on, the former clustering will be referred to as “low-resolution clustering”, with the “10D_05R” ID, and the latter as “high-resolution clustering” with the “10D_1R” ID.
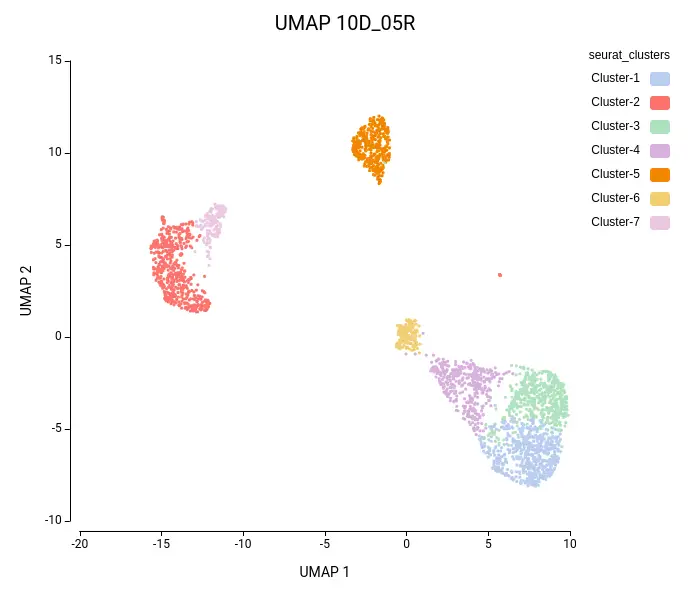
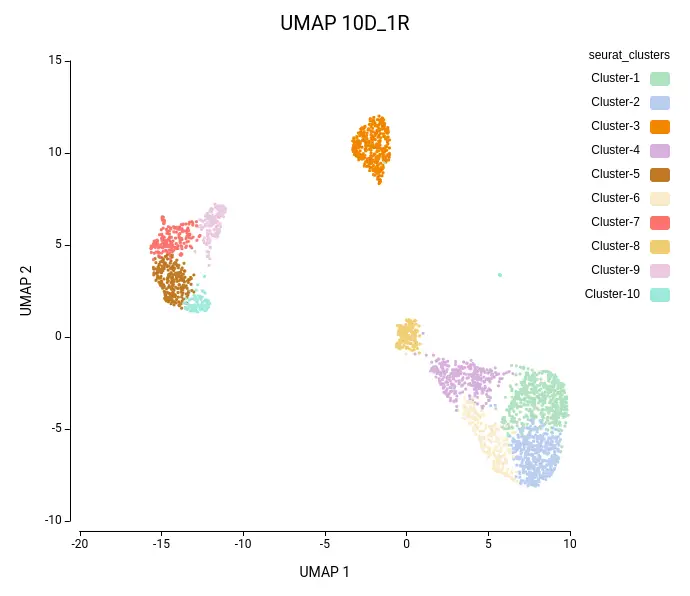
As expected, the default configuration produced seven clusters (Figure 7), while the higher-resolution setting yielded ten clusters (Figure 8). As evidenced by the UMAP representations, Cluster-2 in the low-resolution clustering has been subdivided into three smaller clusters in the high-resolution clustering. Moreover, the high-resolution clustering yielded an additional Cluster-6, composed of cells belonging to Cluster-4 and 1 in the other clustering.
Clustering Assessment
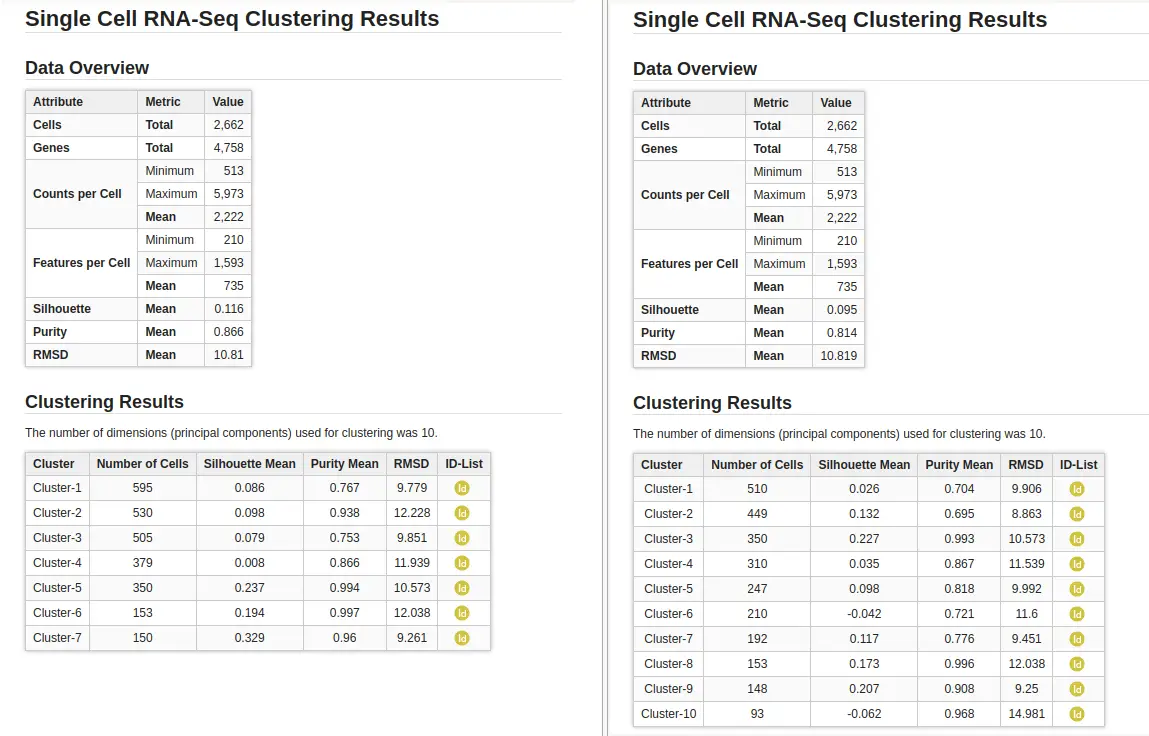
In addition to the clusters, the group of cells with similar expression profiles, the analysis also provides a set of statistics to evaluate the consistency and structure of those clusters. Those statistics are explained in the introduction section above: the Silhouette, Purity, and Root Mean Square Deviation (RMSD). While the overall dataset metrics were comparable between both clustering resolutions (Figure 9), a closer look at the per-cluster values revealed some differences.
In the lower-resolution clustering (Figure 7), Cluster-2 exhibited a high RMSD and a low Silhouette score, suggesting internal heterogeneity. This is evidenced by the lower tail of the violin plot and the RMSD bar chart (Figure 10, left plots). At higher resolution (Figure 8), this cluster was subdivided into three smaller groups (Clusters 5, 7, and 10). Cluster-10 still had a high RMSD, likely due to the outlier cell present at the right part of the UMAP.
In addition, Cluster-4 showed a high RMSD combined with the lowest Silhouette value, suggesting unstable grouping. In the higher-resolution configuration, part of this cluster was reorganized into an additional group, which also incorporated a few cells from a neighboring cluster (Figure 8, Cluster-6). Due to the proximity to surrounding clusters, this new partition exhibited a low Silhouette score.
On the other hand, clusters with low Purity values tended to be spatially close in the UMAP representation, suggesting related or transitioning cell populations. As expected, clusters from the higher-resolution configuration generally displayed lower Purity scores, reflecting the closer proximity and intermingling of more fine-grained subtypes.
Overall, these observations align with the expected behavior of clustering quality metrics:
- High RMSD and low Silhouette indicate clusters that may benefit from further subdivision.
- Low Purity is common in higher-resolution analyses where broader groups are subdivided.
- Clusters with low Purity and spatial proximity on the UMAP may represent biologically related subtypes or transitional cell states.
Together, these metrics provide a clear framework for assessing the structure and resolution of scRNA-seq clusterings, helping identify clusters that are well-defined versus those that could be refined or merged.
Further Exploration with Cell Type Prediction
To further explore the differences between the two clustering configurations, we performed Cell Type Prediction using the CellKb implementation in OmicsBox. The CellKb database was filtered to include references from healthy human blood and immune tissues. The resulting predicted cell types were highly consistent between both runs (Figures 11 and 12).
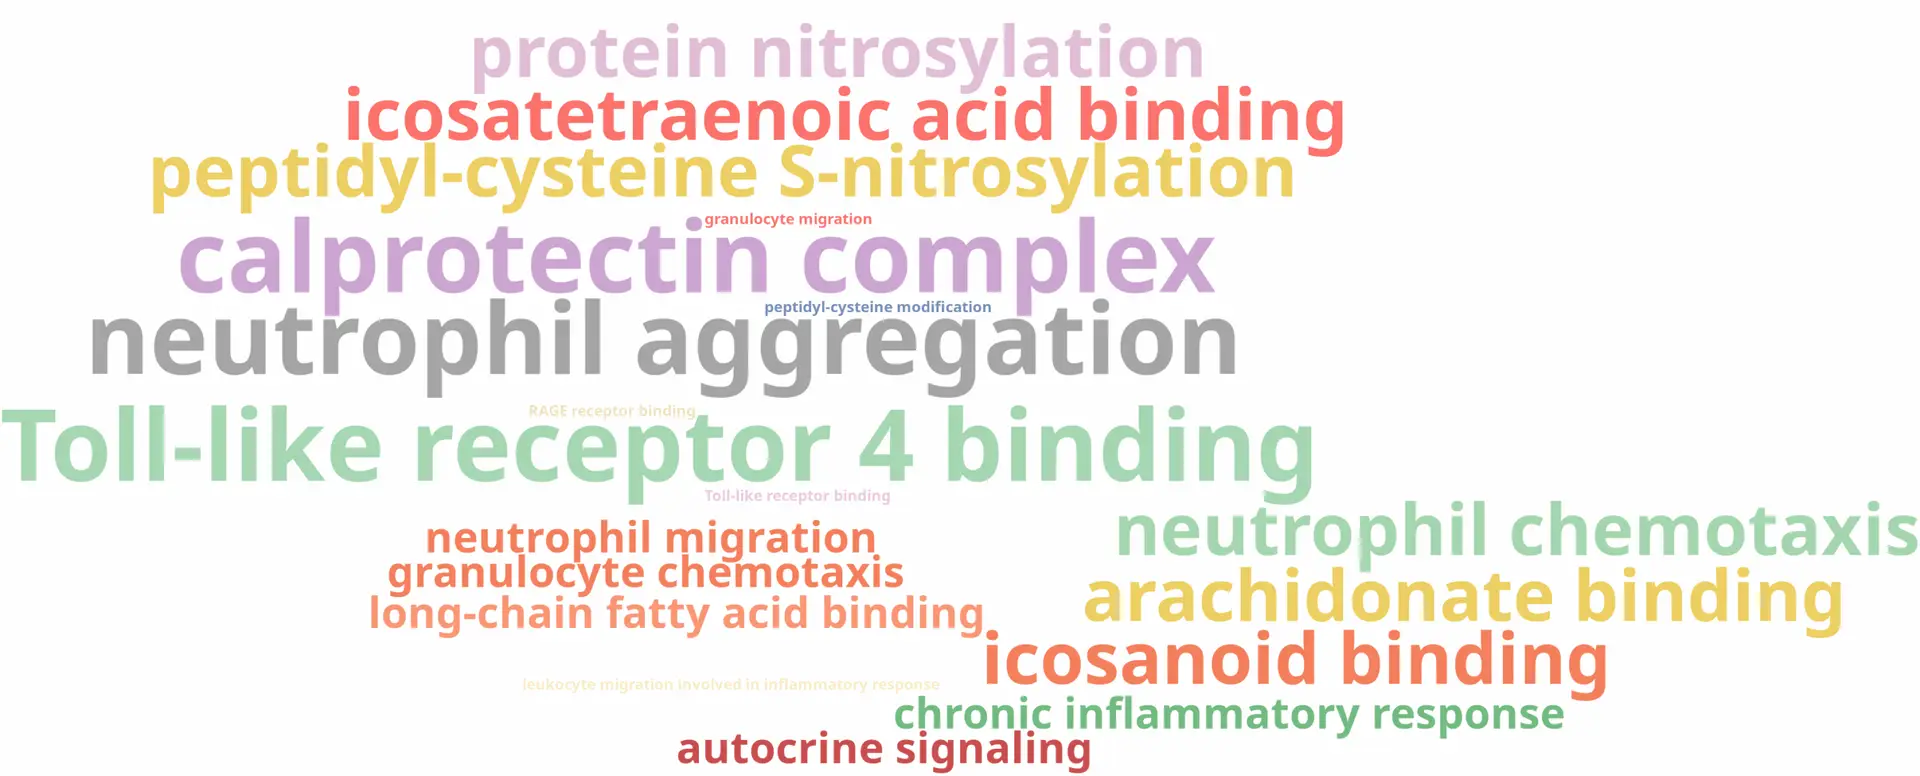
Interestingly, the three subclusters obtained in the higher-resolution clustering were all labeled as monocytes. To better understand the biological basis of this subdivision, we performed scRNA-Seq differential expression analysis using the edgeR implementation in OmicsBox, comparing each subcluster against the other two, followed by functional enrichment analysis using Fisher’s Exact Test.
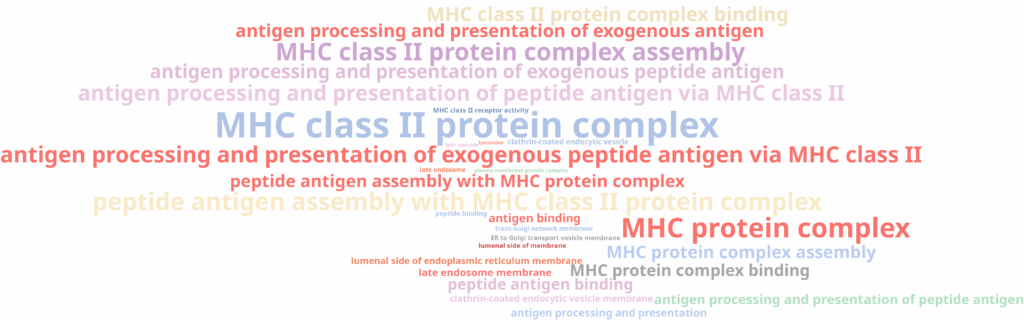
The results revealed that one subcluster showed enrichment for immune and inflammatory response functions (Figure 13), while another was enriched for MHC class II and antigen presentation (Figure 14). Those functions are in line with biological subtypes of the monocytes: inflammatory/classical monocytes and more mature, non-classical monocytes, respectively. The third subcluster did not display any significant enrichment, suggesting it may represent an instance of over-clustering rather than a true biological distinction.
Similarly, the additional Cluster-6 identified in the high-resolution configuration was annotated with a cell type closely related to the surrounding clusters and its counterpart in the lower-resolution clustering (Figures 11 and 12). This cluster also exhibited low Silhouette and Purity scores (Figure 10), further suggesting weak separation and potential over-clustering. Since these closely related clusters were all labeled as a subtype of the T cell populations, a targeted subclustering and/or further manual curation would be a suitable next step to better resolve potential subtypes.
Overall, these results illustrate how higher-resolution clusterings can both reveal meaningful cellular subpopulations and introduce artificial partitions. Therefore, combining insights from multiple clustering configurations provides a more reliable framework for refining annotations. The interactive OmicsBox interface supports this iterative process by allowing users to:
- Select and re-label cells directly in the UMAP.
- Export and import cell metadata between projects, facilitating label migration
- Extract count tables from specific cell groups for focused re-clustering of ambiguous populations.
Conclusions
This analysis demonstrates how clustering quality assessment metrics (Silhouette, Purity, and RMSD) can provide valuable insights into the structure and resolution of scRNA-seq clusterings. These metrics help identify clusters that are well-defined, those that may contain internal substructure, and potential cases of over-clustering.
In practice, these clustering quality metrics can be directly leveraged in OmicsBox to guide data exploration and refinement. By comparing multiple clustering configurations, users can identify clusters that are well-defined and stable, as well as those that may contain substructure or overlapping cell types. Starting with a robust, well-separated clustering and then iteratively refining it using higher-resolution settings provides a balanced approach, capturing both the broad cellular organization and finer subpopulations present in the data.
About the Author Marta Benegas
 studied biotechnology at the Valencia Polytechnic University (UPV) and continued her studies with a Master's in Bioinformatics at the Autonomous University of Barcelona (UAB), Spain. After her master's degree, she started her professional career at Biobam where she is now working as a bioinformatics specialist and support manager.
At the moment she is mainly focused on Single-Cell technologies developing various pipelines which allow getting from reads to functional insights at a single-cell resolution. These developments are available in OmicsBox, BioBam’s software solution.
Marta Benegas
Marta Benegas studied biotechnology at the Valencia Polytechnic University (UPV) and continued her studies with a Master's in Bioinformatics at the Autonomous University of Barcelona (UAB), Spain. After her master's degree, she started her professional career at Biobam where she is now working as a bioinformatics specialist and support manager.
At the moment she is mainly focused on Single-Cell technologies developing various pipelines which allow getting from reads to functional insights at a single-cell resolution. These developments are available in OmicsBox, BioBam’s software solution.
")
