Introduction
Single-cell RNA sequencing (scRNA-seq) is a technology that aims to study the expression profiles of individual cells, in contrast with the typical bulk RNA sequencing that analyses the expression of large populations of cells together. scRNA-seq allows the identification of different cell types within the same sample, so it is possible to study tissues with more detail.
One of the most common and usually the first step in scRNA-seq analysis is the clustering of cells. This step aims to find groups of cells with similar expression patterns, which may correspond to similar cell types. There is a wide variety of algorithms to perform the clustering, being Seurat package one of the most widely used by the scientific community.
Since OmicsBox 2.0, the Single Cell Clustering based on Seurat, along with the necessary preprocessing steps, is available as an OmicsBox App for the Transcriptomics Module.
How to run Seurat Clustering from within Omicsbox
- The input is a Count Table, that is, a table with cells in columns, genes in rows, and expression level as values. It can be a .txt file or an OmicsBox project generated with the Create Count Table tool in the Transcriptomics module. The last option is suited for full-length technologies such as SMART-seq, SMARTer, etc.
- This analysis consists of several steps, which can be configured in the wizard:
- Filtering of low-quality cells and lowly expressed genes.
- Integration of datasets coming from multiple samples, that is different conditions, time spans, batches, etc.
- Preprocessing of data to prepare it for the clustering step. This includes normalization, dimensional reduction, and optional data correction.
- Clustering of cells into groups that have similar expression patterns.
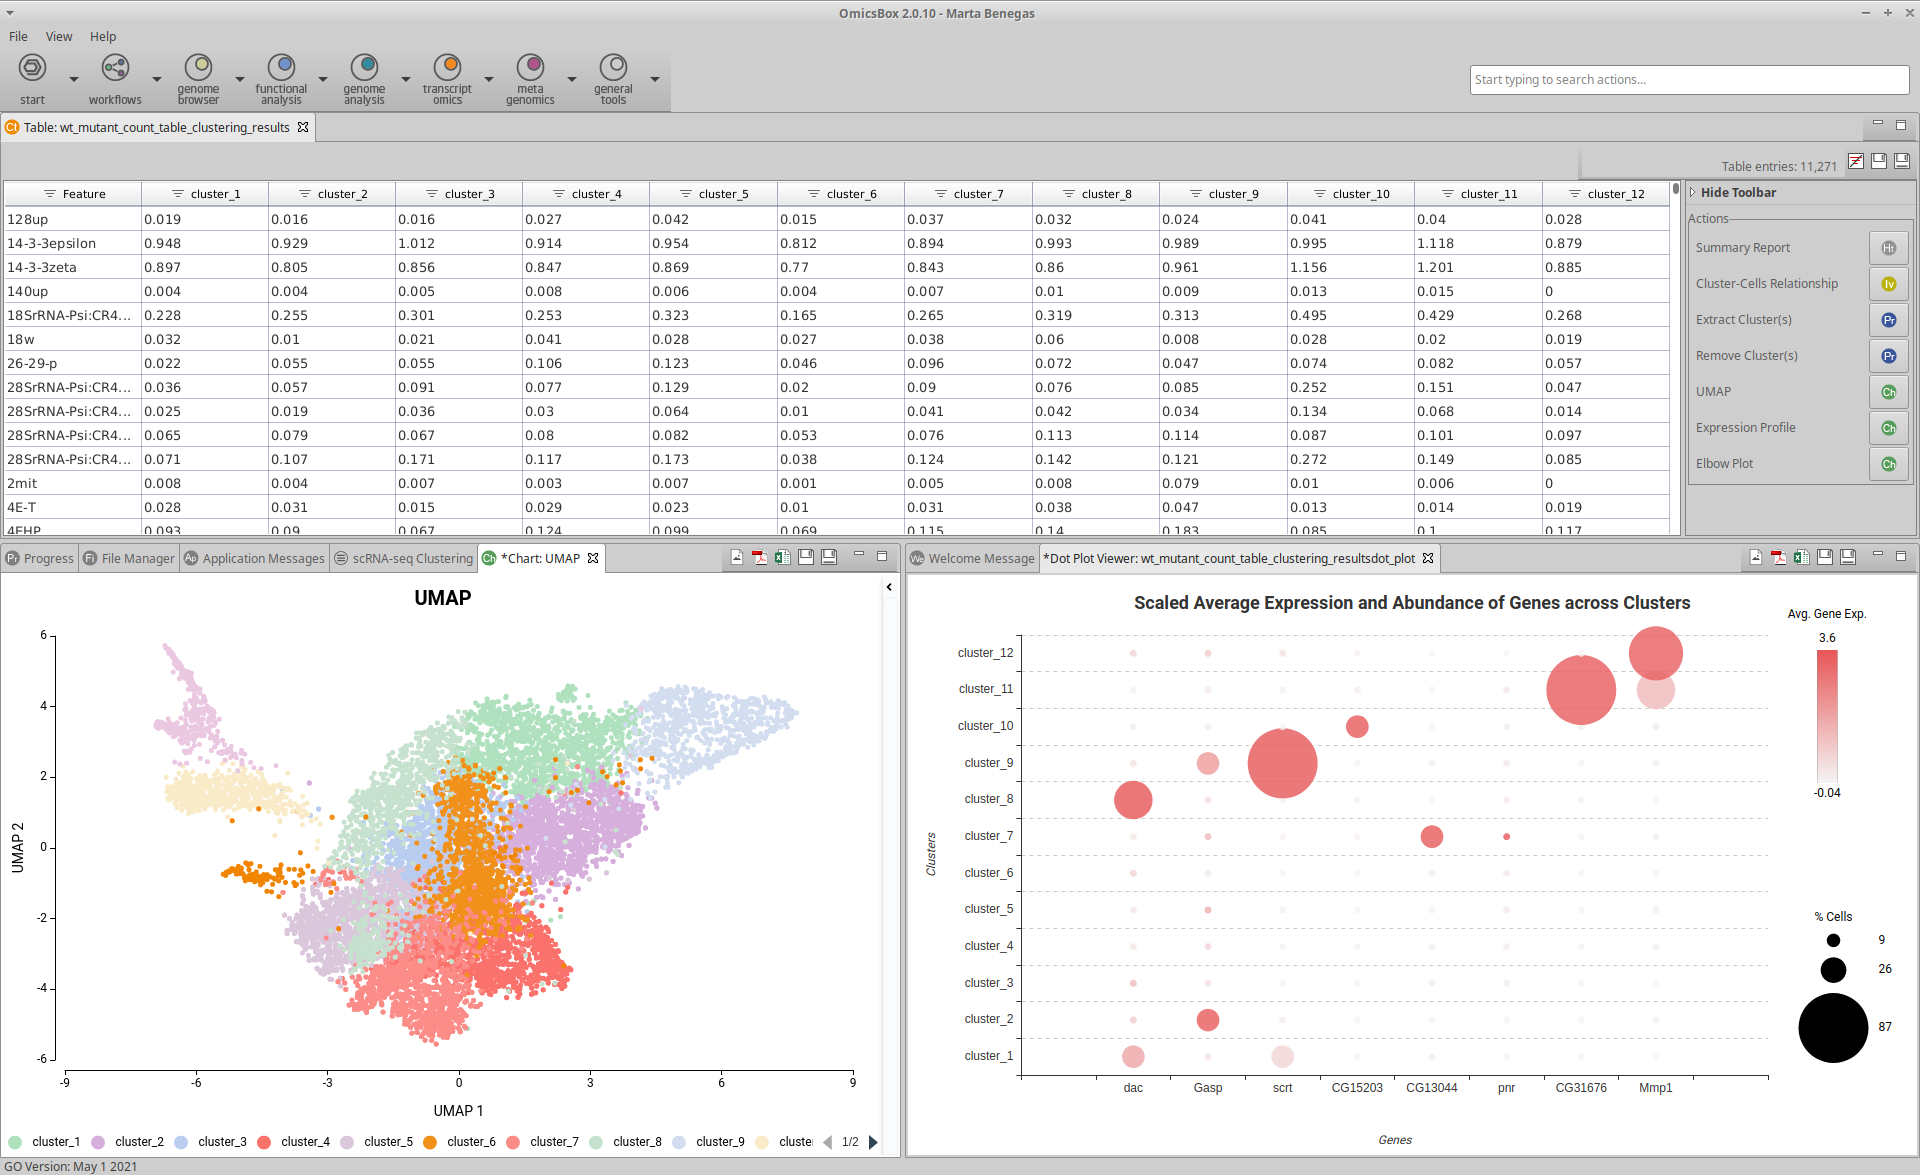
- The output is a Count Table with clusters instead of cells in columns, and genes in rows. The values are the average gene expression across all the cells belonging to each cluster. It also generates a Summary Report, a Uniform Manifold Approximation and Projection (UMAP) visualization, and an Elbow Plot to evaluate the clustering parameters. In addition, it is possible to generate additional charts to manually annotate clusters using reference gene markers.
Note: It is good practice to run the Clustering several times with different parameters and explore the results. For example, check if there’s too few or too many clusters: in the first case, clusters could be composed of many different cell types, and the second case could be indicative of spurious clusters generated by noisy data.
Note: One of the parameters that most affect the Clustering is the Number of Dimensions, that is, the number of Principal Components used for the Clustering Algorithm. Keeping too few dimensions could miss important information to distinguish between similar cell types. However, keeping too many dimensions could introduce noisy signals and produce spurious clusters. The Elbow Plot helps to decide the number of dimensions to use.
Note: Data correction depends on the dataset and the aim of the study. For example, correcting cell cycle genes signal could prevent clustering cells that are in the same developmental stage, whether they come from the same cell type or not. However, in some cases these differences in cell cycle may be informative since they could be treated as an indicative of proliferating cell populations which can be different across treatment conditions, for example.
References
- OmicsBox – Bioinformatics made easy (Version 2.0.10). BioBam Bioinformatics. March 3, 2019.
- Hao, Y., e. al. (2021). Integrated analysis of multimodal single-cell data. Cell.
- Stuart, T., et al. (2019). Comprehensive Integration of Single-Cell Data. Cell, 177(7), 1888-1902.e21.
Useful Links
About the Author Marta Benegas
 studied biotechnology at the Valencia Polytechnic University (UPV) and continued her studies with a Master's in Bioinformatics at the Autonomous University of Barcelona (UAB), Spain. After her master's degree, she started her professional career at Biobam where she is now working as a bioinformatics specialist and support manager.
At the moment she is mainly focused on Single-Cell technologies developing various pipelines which allow getting from reads to functional insights at a single-cell resolution. These developments are available in OmicsBox, BioBam’s software solution.
Marta Benegas
Marta Benegas studied biotechnology at the Valencia Polytechnic University (UPV) and continued her studies with a Master's in Bioinformatics at the Autonomous University of Barcelona (UAB), Spain. After her master's degree, she started her professional career at Biobam where she is now working as a bioinformatics specialist and support manager.
At the moment she is mainly focused on Single-Cell technologies developing various pipelines which allow getting from reads to functional insights at a single-cell resolution. These developments are available in OmicsBox, BioBam’s software solution. 


